FALYS Documentation
Real-time file integrity monitoring and threat response. Everything you need to install, run and tune FALYS.
Introduction
FALYS is a self-hosted file integrity monitoring (FIM) system. A lightweight agent watches folders on Windows or Linux endpoints and reports file events to a central dashboard, which scores them for risk, correlates related activity, and emails alerts to whoever should know. All data is stored in PostgreSQL -- there are no data files.
New here? Read Installation & Setup from top to bottom the first time -- the steps build on each other.
What is in the download
FALYS/
|-- Documentation/
|   |-- index.html               <- this help file
|   `-- images/                  <- screenshots used in the help file
|-- FALYS-server/
|   |-- server/                  <- dashboard + API (Flask) and PostgreSQL layer
|   |   |-- .env.example         <- copy to .env and fill in
|   |   |-- build_output/        <- ready-made agent binaries (Windows + Linux)
|   |   |-- dist/                <- server binary is built here (optional)
|   |   |-- engine/              <- risk scoring / correlation engine
|   |   |-- static/, templates/  <- dashboard CSS/JS and HTML pages
|   |   |-- tests/
|   |   `-- server.py            <- Flask app entry point
|   `-- agent/                   <- endpoint agent source + build scripts
|-- Changelog.txt
|-- Licenses.txt                 <- third-party credits
`-- README.txt
Key features
- Cross-platform agent (Windows service / Linux systemd unit), delivered as a single compiled binary -- no Python required on endpoints.
- Per-agent alert routing: each deployment package can send its alerts to a specific recipient rather than a single shared list.
- Risk scoring and event correlation engine.
- Verified user attribution via OS audit logs (auditd on Linux, Security event log on Windows) rather than trusting the agent's own process owner.
- Self-signed TLS by default, with certificate pinning between each agent and the server; bring your own CA-issued certificate if you have one.
- LAN auto-discovery so agents can find the server again if its IP changes.
- Agent-to-server tunnel support for endpoints that cannot reach the server directly.
Requirements
- PostgreSQL 12+ (tested on 16) -- required; FALYS keeps all of its data there.
- To run from source: Python 3.9+ (both server and agent).
- To run a compiled server binary: build it once with
server/build_server_exe.ps1(Windows) orserver/build_server_exe_linux.sh(Linux); no Python is then needed on the machine that runs it. - To receive email alerts: a Gmail account with 2-Step Verification and an App Password (free, takes a couple of minutes -- steps in Installation & Setup).
- Agent endpoints: Windows (x86-64) or Linux (x86-64). Agents need no Python.
Support
Support for this item is provided through the item's Comments
/ Support tab on CodeCanyon. Please include your operating
system, the FALYS version (server/build_output/VERSION.txt)
and the relevant console output.
Installation & Setup
This covers getting the FALYS server running, configuring email alerts, logging in, and deploying your first agent. Read it top to bottom the first time -- the steps build on each other.
1. Choose how you'll run the server
First: PostgreSQL
FALYS stores all of its data -- events, agent keys, settings, risk rules, alert history -- in PostgreSQL. There are no data files, so a database has to exist before the server starts. Any PostgreSQL 12+ works (tested on 16), on this machine or another one.
Quickest way to get one (needs Docker):
cd server
docker compose -f docker-compose.postgres.yml up -d
Or use an existing PostgreSQL server -- create an empty database and a role that can create tables in it. The exact commands, connection options and backups are in PostgreSQL Setup.
Then tell FALYS where it is, in server/.env (copy
.env.example):
FALYS_DATABASE_URL=postgresql://falys:change-me@localhost:5432/falysThe server creates its tables automatically on first start, and exits with a clear message if it can't reach the database.
Upgrading an older flat-file install? Stop the
server and run python migrate_flat_files_to_postgres.py
once from server/ -- it imports the old logs/
folder (events keep their ids). See PostgreSQL Setup.
You have two ways to run the server itself. Pick one.
Option A -- Build the server binary once (Windows or Linux)
The server is delivered as source. A server binary has to be built on the operating system it will run on, and this is a one-time step (on a Windows machine with Python 3.9+):
cd server
.\build_server_exe.ps1
Output: server\dist\FalysServer.exe -- self-contained,
no Python needed on the machine that runs it. Put your .env
(with the database settings) in the same folder as the .exe and run
it:
.\FalysServer.exeThe dashboard will be reachable at
https://localhost:8088 (see the note on TLS in Section
4).
Linux server binary instead? Run
server/build_server_exe_linux.shonce on a Linux machine with Python 3.9+ -- see that script's header comment for details. Output:server/dist/falys-server.
Agent binaries are included. The dashboard's
Agents -> Generate & Download button zips a
compiled agent binary together with a fresh, per-deployment
config.json and the server's cert.pem.
Ready-made agent binaries for Windows (FalysAgent.exe) and
Linux (falys-agent) are already in
FALYS-server/server/build_output/, so the button works
immediately for both platforms. They were compiled from the agent source
in FALYS-server/agent/ -- see Building the agent binaries if
you want to verify or rebuild them.
Option B -- Run from source (Windows, Linux, or macOS)
Requires Python 3.9 or newer.
cd server
python3 -m venv venv
source venv/bin/activate        # Windows: venv\Scripts\activate
pip install -r requirements.txt
python3 server.py
Make sure the database settings are in .env first (see
above), and configure email alerts (Section 2) before your first
run.
2. Configure email alerts
FALYS sends alert emails through a Gmail account over SMTP. You need a dedicated Gmail account for this -- don't use your personal inbox, since the credential lives in a config file on the server.
- Create (or choose) a Gmail account that exists only to send FALYS alerts.
- Turn on 2-Step Verification on that account:
myaccount.google.com-> Security -> 2-Step Verification. - Generate an App Password:
myaccount.google.com-> Security -> App Passwords -> create one named "FALYS". Google gives you a 16-character password -- copy it. - In
server/, copy.env.exampleto.env:cd server cp .env.example .env # Windows: copy .env.example .env - Open
.envand fill in:FALYS_GMAIL_SENDER=your-dedicated-account@gmail.com FALYS_GMAIL_APP_PASSWORD=the16characterapppassword - Save.
server.pyloads.envautomatically -- no extra steps.
Keep .env private. Don't commit it to
git, don't upload it anywhere, don't include it if you ever share this
project folder with anyone. If an app password is ever exposed, revoke
it immediately at
myaccount.google.com -> Security -> App Passwords and
generate a new one -- old alerts will simply start failing until you
update .env with the replacement.
If you'd rather set these as real environment variables instead of a
.env file (e.g. for a system service), see
run_falys.sh.example / run_falys.ps1.example
in server/ for the equivalent launcher scripts -- copy one,
fill it in, and use it in place of running server.py
directly. Don't fill in both .env and a launcher script
with different values; whichever sets a variable first wins.
Until email is configured, the server still runs fine -- alerts are just logged as skipped instead of sent.
3. First run and login
Start the server (whichever option you chose in Section 1). On first run, watch the console output:
========================================================================
[FALYS][FIRST RUN] The following secret(s) were not set via the
environment, so a new random value was generated and saved to
the PostgreSQL database (table server_kv) for reuse on future restarts:
    FALYS_ADMIN_PASSWORD  (admin console password):  <random value>
    FALYS_DISCOVERY_TOKEN  (LAN discovery token):  <random value>
Set these explicitly via your environment for any real deployment
instead of relying on the auto-generated value.
[FALYS] Log in to the dashboard with username 'admin' and
the auto-generated password printed above.
========================================================================
Copy that generated password (or set
FALYS_ADMIN_PASSWORD yourself in .env
beforehand to skip this). Open the dashboard URL shown in the console
and log in with:
- Username:
admin(or yourFALYS_ADMIN_USERNAME, if set) - Password: the value from the console, or your
FALYS_ADMIN_PASSWORD
The generated password is saved in the PostgreSQL database so it
survives a restart -- but set FALYS_ADMIN_PASSWORD
explicitly in .env for any real deployment rather than
relying on that.
4. TLS (HTTPS)
TLS is on by default. The server generates its own self-signed
certificate on first run under server/certs/. This is
expected -- there's no public certificate authority for a LAN-only
server, so your browser will show a certificate warning the first time
you visit the dashboard; that's normal for a self-signed cert and safe
to proceed through on your own network.
Each deployed agent pins the server's exact certificate (shipped as
cert.pem inside its deployment package) rather than relying
on a browser-style trust chain. If you ever regenerate the server's
certificate (e.g. its LAN IP changes enough that the old certificate no
longer covers it), redeploy affected agents so they pick up the new
cert.pem.
If your organization has a real internal CA-issued certificate, point
FALYS_TLS_CERT / FALYS_TLS_KEY at it in
.env instead of using the self-signed default. To disable
TLS entirely for a throwaway local test (never for a real deployment),
set FALYS_TLS_ENABLED=0.
5. Deploy your first agent
From the dashboard, go to Agents -> Deploy a New Agent:
- Choose the platform (Windows or Linux).
- Enter the folder on the target machine you want watched (e.g.
C:\Monitoror/var/data). - Enter the alert email for this agent -- the address that should receive alerts for events from this specific endpoint.
- Click Generate & Download.
This produces a zip containing the compiled agent binary, a
config.json pre-filled for this deployment, the
server's cert.pem and a short README.txt. Copy the extracted folder to the target
machine and:
- Windows: double-click
FalysAgent.exe, accept the one admin prompt. It installs and starts itself as a Windows service. - Linux:
sudo ./falys-agent. It installs and starts itself as a systemd service.
That's the whole install -- no Python, no manual service setup on the endpoint either way.
The compiled agent binaries are already in
server/build_output/, so the button works instantly for
both platforms. Rebuild an agent binary whenever you modify the agent
source: run agent/build_exe.ps1 (Windows) or
agent/build_exe_linux.sh (Linux) and drop the result, with
its VERSION.txt, into server/build_output/.
Full details are in Agent
Deployment.
For verified (not just process-owner) attribution of who touched a file, see File Event Attribution -- the compiled agents set this up for you during install (see that section for when a manual step is still needed).
Always deploy agents through the dashboard's Agents
page -- it's the only supported way to get a correctly-configured
config.json (server URL, certificate, and a unique
per-agent key) onto an endpoint.
6. Environment variable reference
All variables below can be set in server/.env (copy from
.env.example) or as real environment variables. See
.env.example for the full commented version.
| Variable | Required? | Default | Purpose |
|---|---|---|---|
FALYS_DATABASE_URL |
Yes | (none) | PostgreSQL connection URL, e.g.
postgresql://falys:pw@localhost:5432/falys |
FALYS_DB_HOST / _PORT / _NAME
/ _USER / _PASSWORD /
_SSLMODE |
Alternative to the URL | localhost / 5432 / falys /
falys / (empty) / prefer |
Individual connection settings (ignored when
FALYS_DATABASE_URL is set) |
FALYS_DB_POOL_MAX |
No | 20 |
Max simultaneous database connections |
FALYS_DB_CONNECT_TIMEOUT_SECONDS |
No | 30 |
How long (seconds) the server keeps retrying the database connection at startup |
FALYS_EMAIL_WORKERS |
No | 6 |
Background threads that send alert e-mails |
FALYS_EMAIL_QUEUE_MAX |
No | 5000 |
Alert e-mails that can wait in the queue; beyond this they are not sent and are recorded in the e-mail log |
FALYS_WAITRESS_THREADS |
No | 128 |
Worker threads of the built-in web server (dashboard connections and agent requests) |
FALYS_RECENT_CACHE_SIZE |
No | 5000 |
Recent events kept in memory for the live dashboard |
FALYS_NO_AUTO_OPEN |
No | (off) | Set to 1 to stop the server opening the dashboard in a browser at startup (use on headless servers and services) |
FALYS_TRUST_PROXY |
No | (off) | Set to 1 only when FALYS runs behind a reverse proxy you control that sets X-Forwarded-For |
FALYS_FORCE_HTTPS |
No | (off) | Set to 1 to keep the session cookie Secure when TLS is terminated by a proxy in front of FALYS (FALYS_TLS_ENABLED=0) |
FALYS_GMAIL_SENDER |
For email alerts | (none) | Gmail address alerts are sent from |
FALYS_GMAIL_APP_PASSWORD |
For email alerts | (none) | App password for that Gmail account |
FALYS_ALERT_RECIPIENTS |
No | (none) | Comma-separated fallback recipients |
FALYS_SENDER_NAME |
No | FALYS |
Display name on alert emails |
FALYS_ADMIN_USERNAME |
No | admin |
Dashboard login username |
FALYS_ADMIN_PASSWORD |
Recommended | auto-generated | Dashboard login password |
FALYS_SECRET_KEY |
Recommended | random per-restart | Session signing key |
FALYS_DISCOVERY_TOKEN |
No | auto-generated | Shared token for LAN auto-discovery |
FALYS_HTTP_PORT |
No | 8088 |
Port the dashboard/API listens on |
FALYS_TLS_ENABLED |
No | 1 |
Set to 0 to disable HTTPS (local test only) |
FALYS_TLS_CERT / FALYS_TLS_KEY |
No | self-signed, auto-generated in certs/ |
Use your own certificate instead |
7. Troubleshooting
- "Email alerting is not configured" warning at startup -- expected until you complete Section 2. Alerts are logged as skipped, not sent, until then.
- "Cannot connect to PostgreSQL" at startup -- the
server can't reach the database in
FALYS_DATABASE_URL/FALYS_DB_*. Check the host/port, the password, that PostgreSQL is running, and that the role may connect from this machine (see PostgreSQL Setup). - "could not create the FALYS tables" -- the database
role lacks
CREATEon its schema; grant it, or applyserver/schema.sqlwith a privileged account. - Forgot the admin password -- set a new
FALYS_ADMIN_PASSWORDin.envand restart. (If you never set one, the generated password is in the database:SELECT value FROM server_kv WHERE key = 'generated_secrets';) - Browser warns about the certificate -- expected for the self-signed default; see Section 4.
- Agent shows "config.json not found" -- the agent
binary and its
config.jsonneed to stay together; make sure you copied the whole extracted deployment folder, not just the executable. - Windows service won't start (Error 1053) / other agent build issues -- see the troubleshooting notes in Agent Deployment.
Using the Dashboard
After you log in (see First run and login in Installation & Setup) you land on the Home page. The menu on the left takes you to every other page. The screenshots below use example data from two test machines.
Home
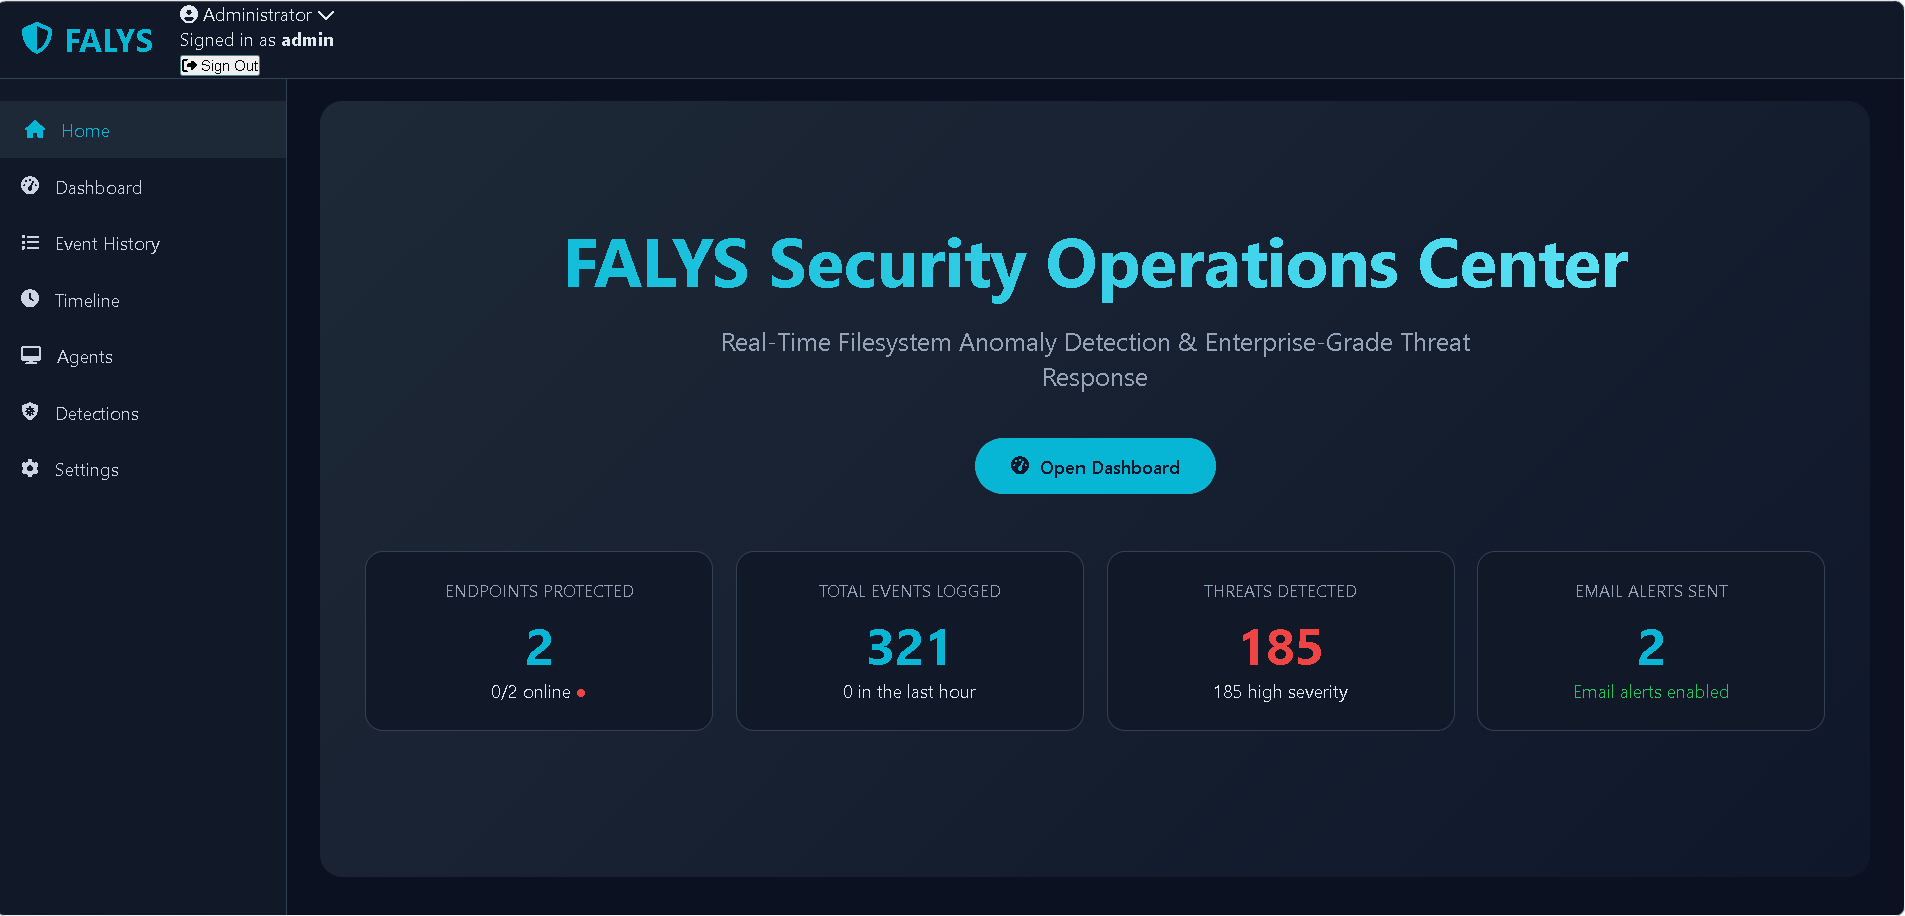
The Home page shows four summary cards: endpoints protected (and how many are online right now), total events logged, threats detected, and email alerts sent. Click Open Dashboard to see the live view.
Dashboard
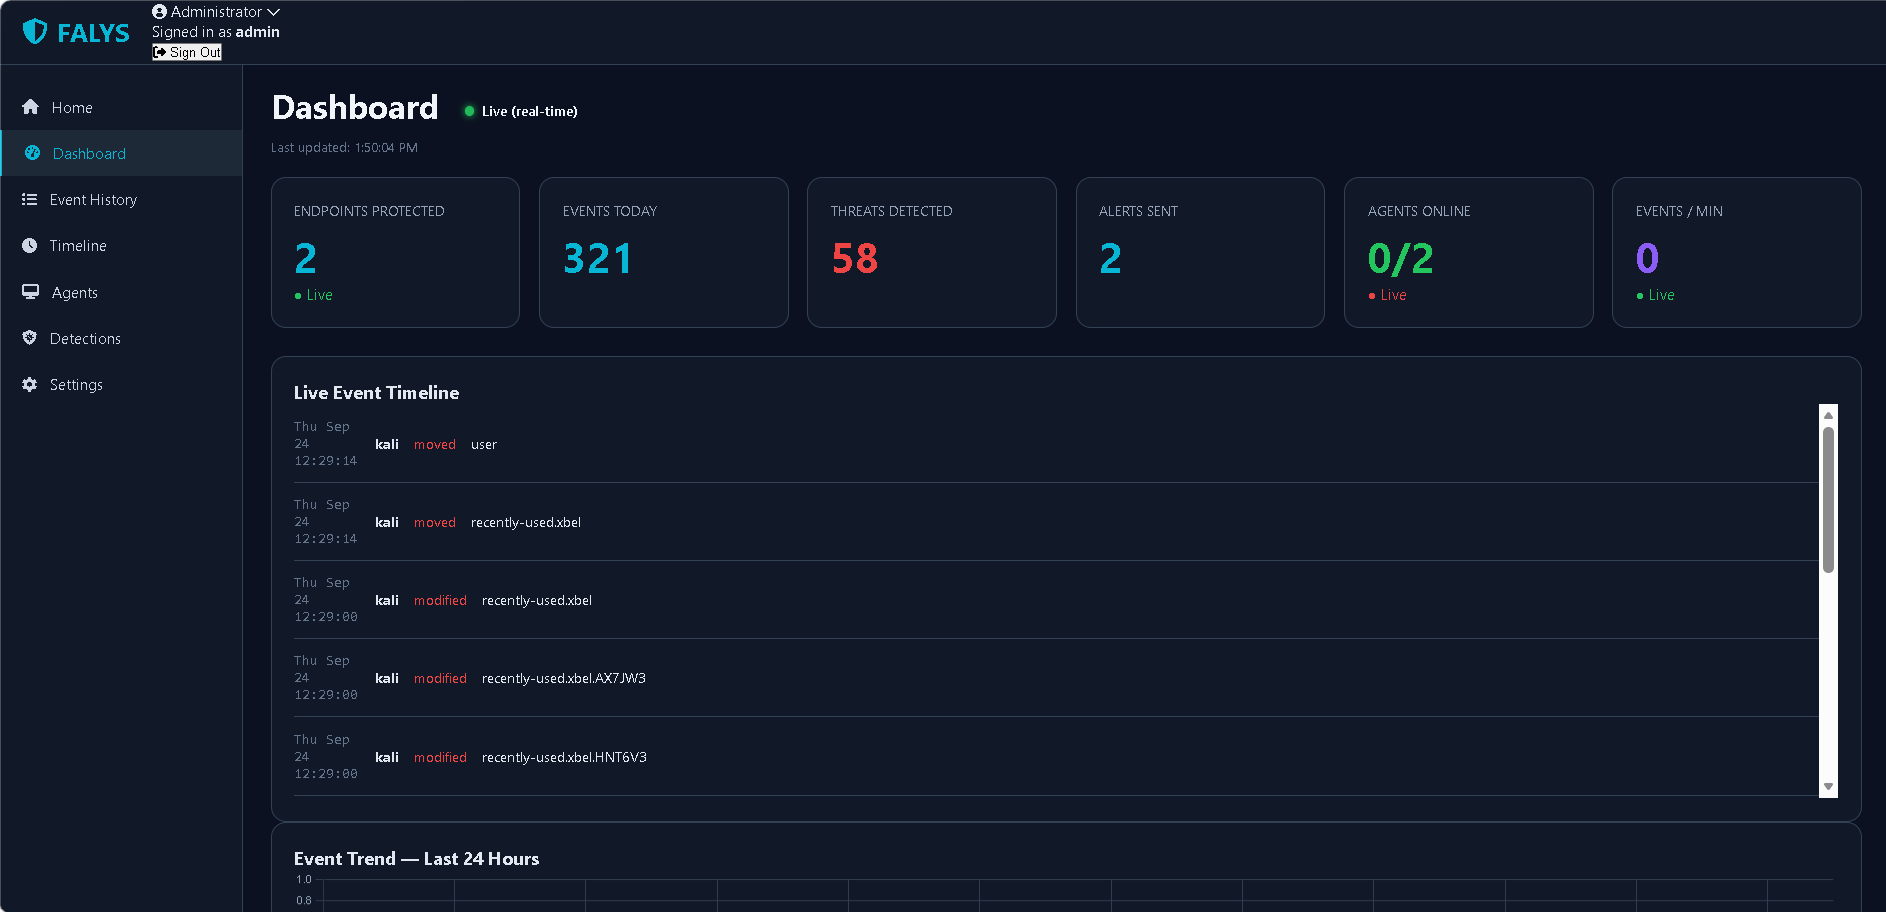
The Dashboard updates in real time. The tiles at the top show endpoints protected, events today, threats detected, alerts sent, agents online and events per minute. Below them, the Live Event Timeline lists the newest file events as they arrive.
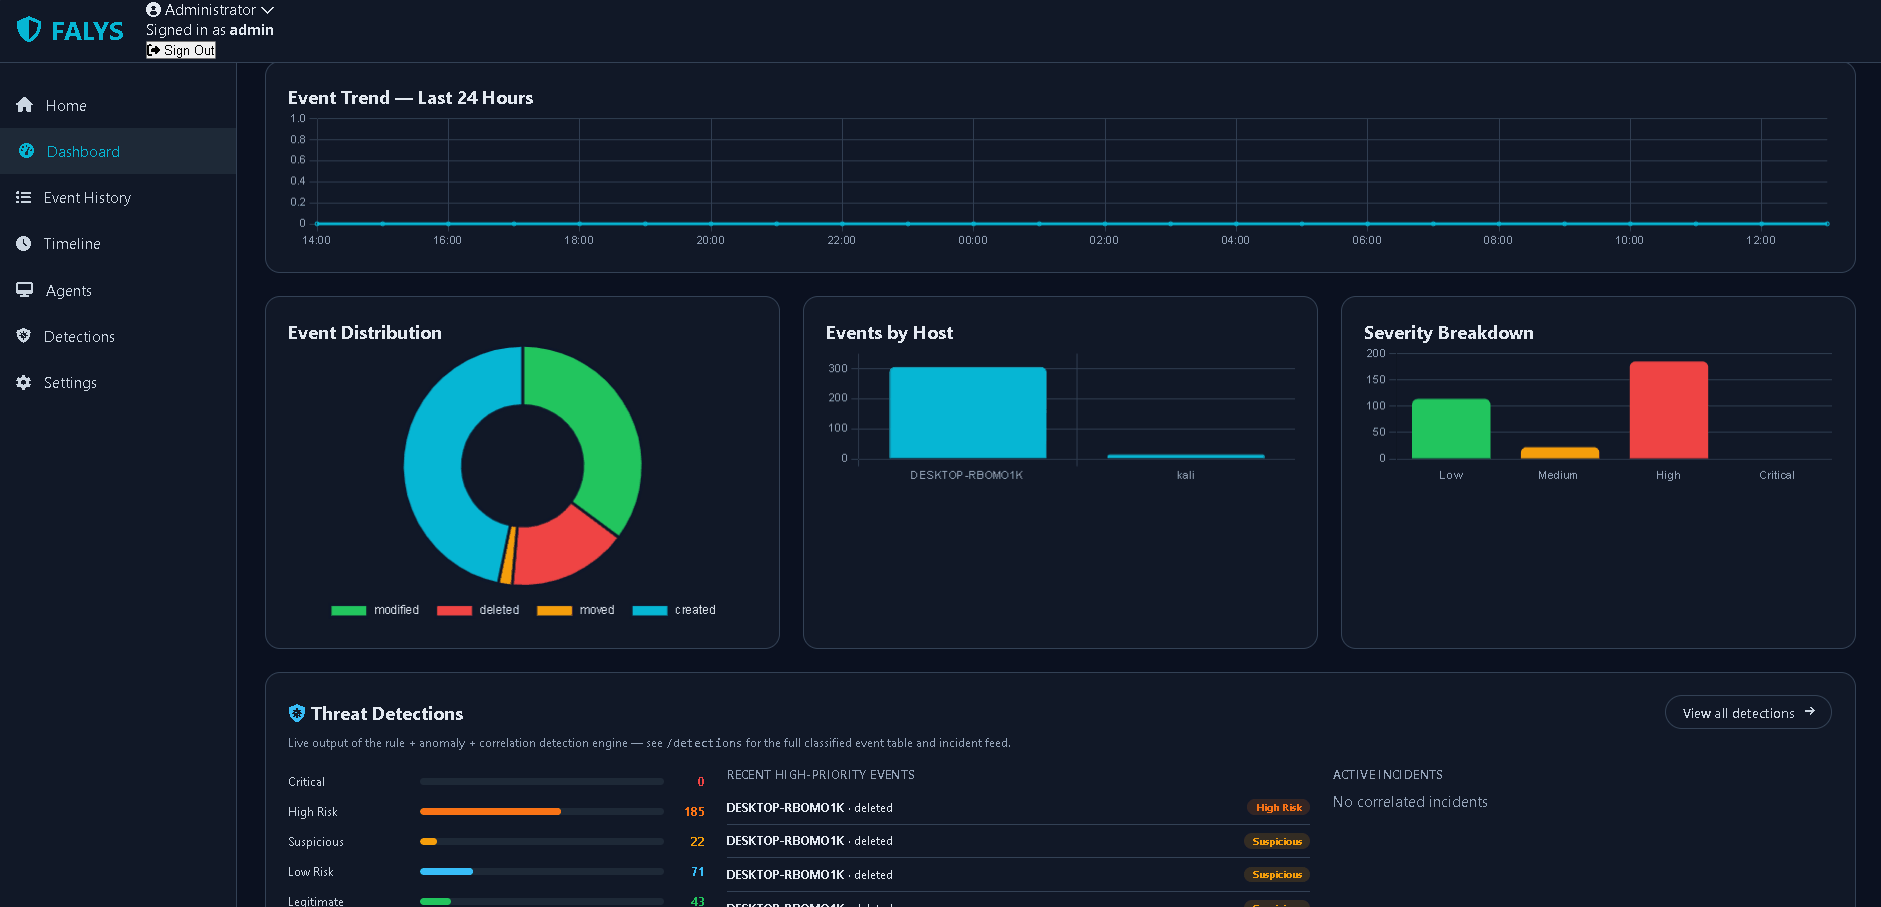
Scroll down for the 24-hour event trend, the event distribution (created, modified, deleted, moved), events per host, and the severity breakdown. The Threat Detections panel summarises how many events fall into each risk class and lists the most recent high-priority events and any active incidents.
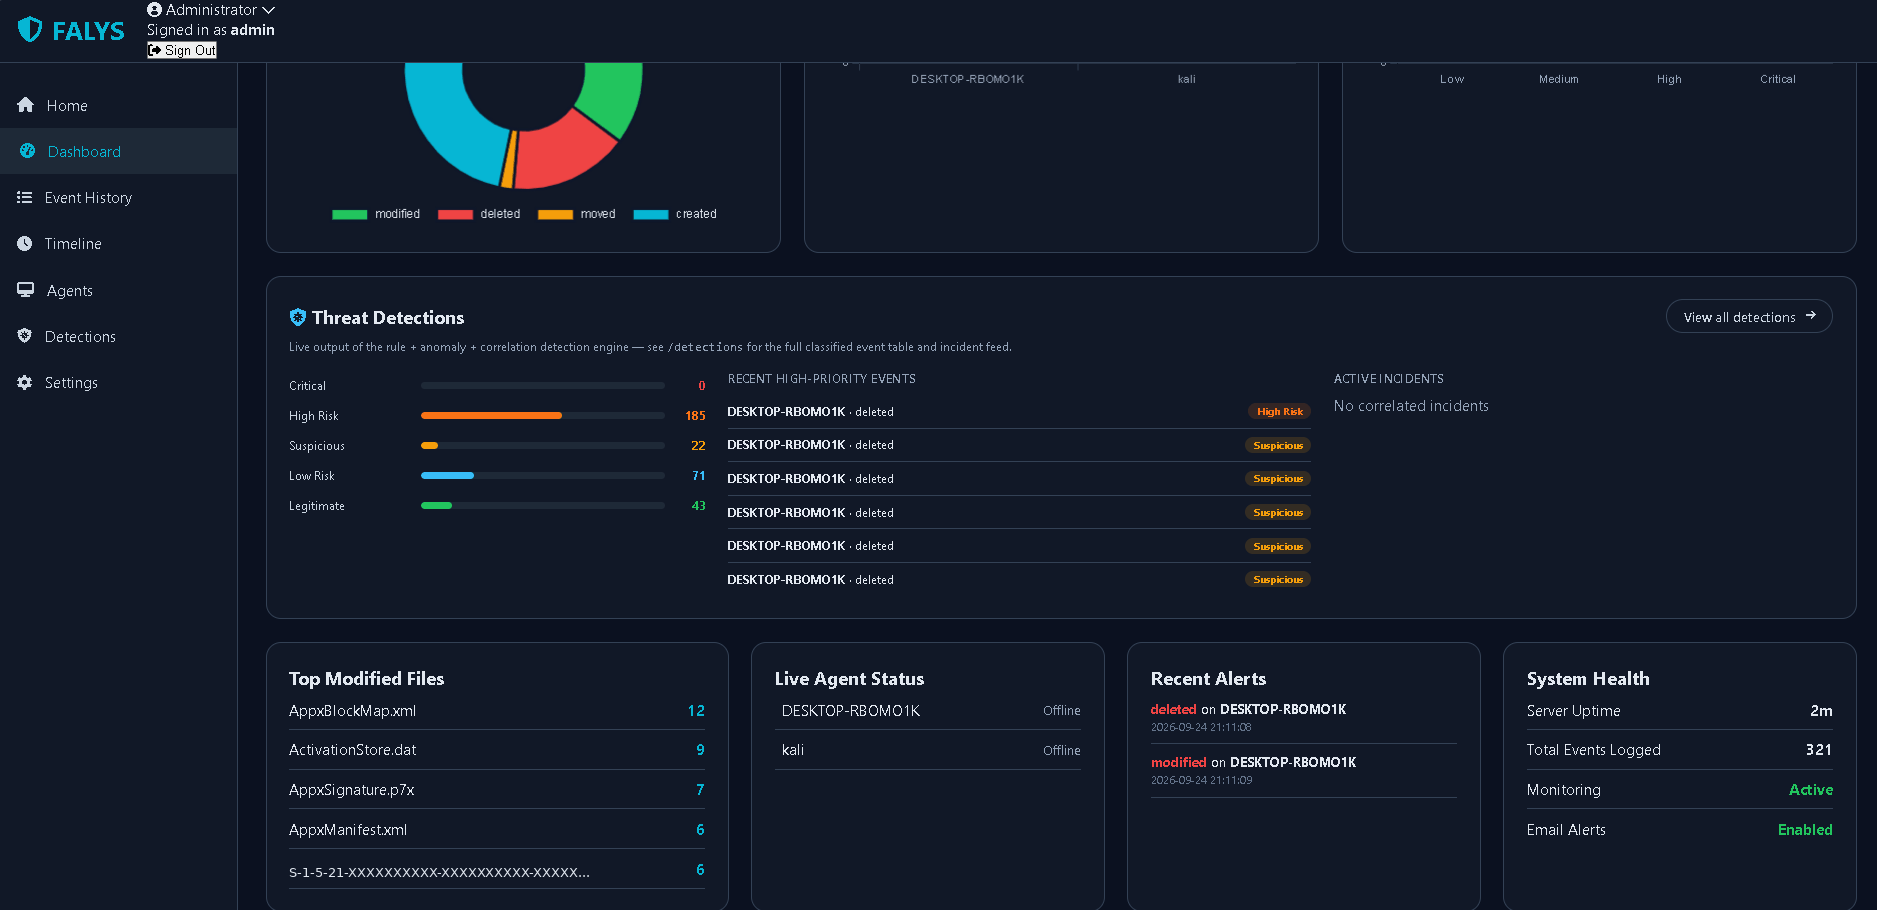
At the bottom you will find the most frequently modified files, live agent status, recent alerts and a small system-health summary.
Event History
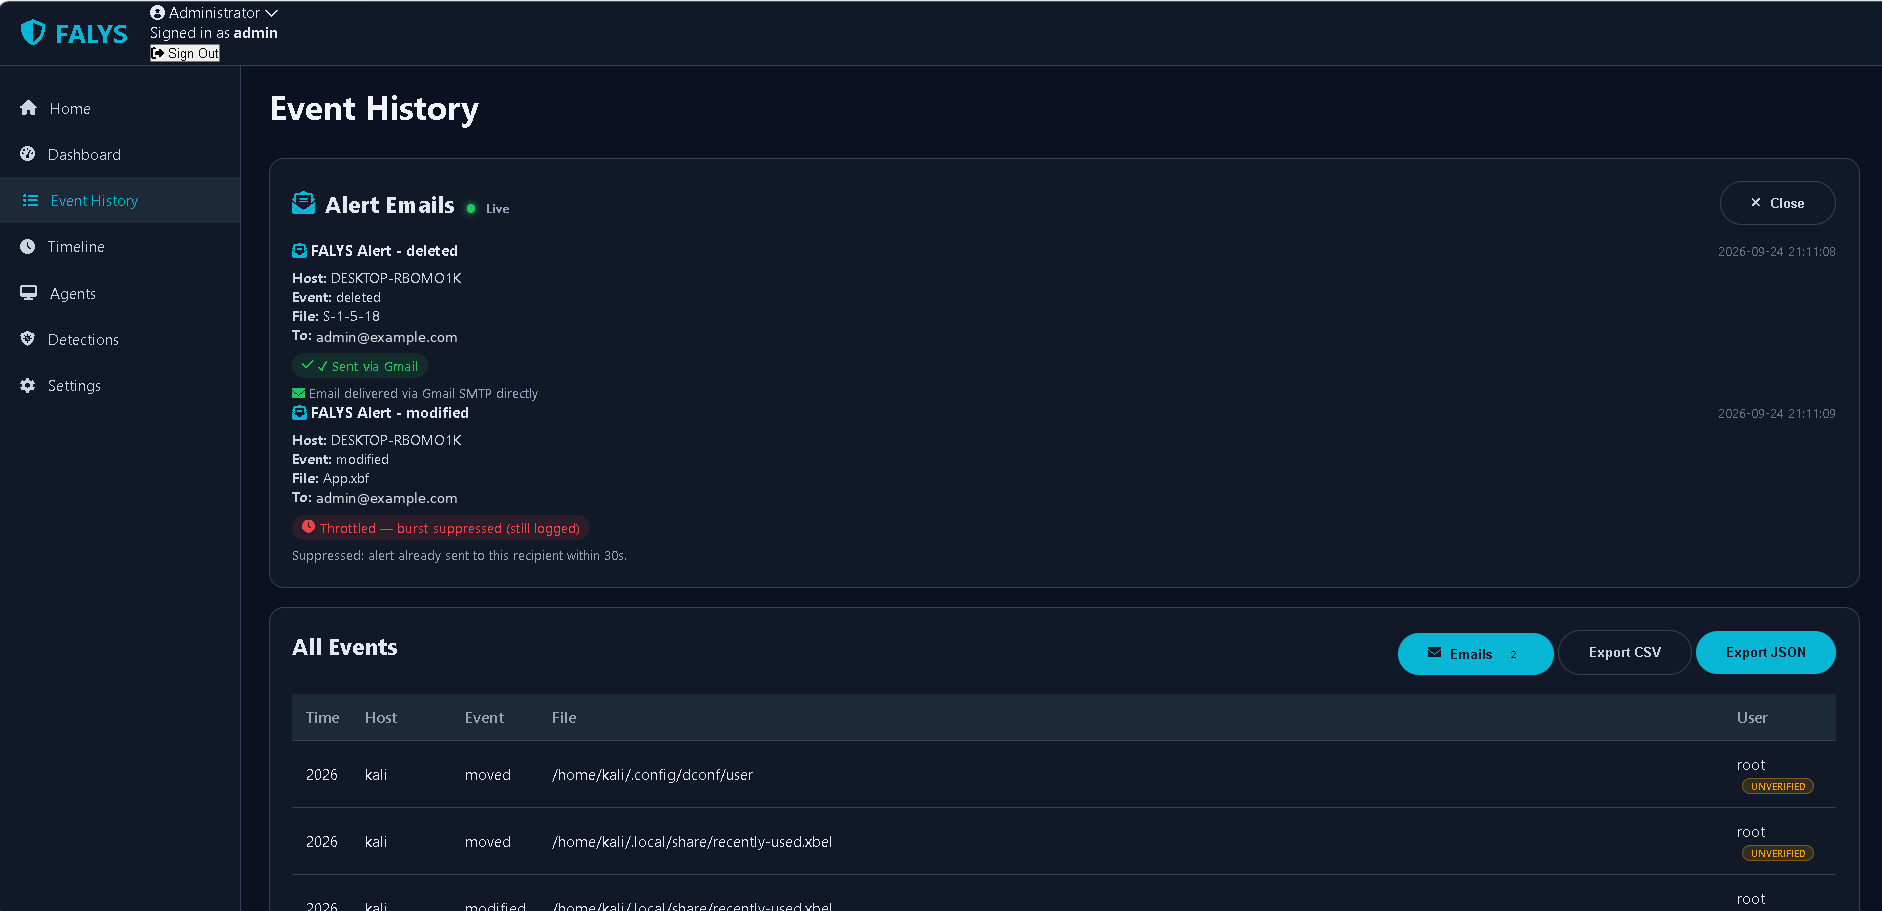
Click Emails to open the alert-email log. Each entry shows the recipient and whether the email was sent or throttled. Throttling limits alerts to one per recipient every 30 seconds so a burst of activity does not flood an inbox; throttled events are still logged and still visible in the dashboard.
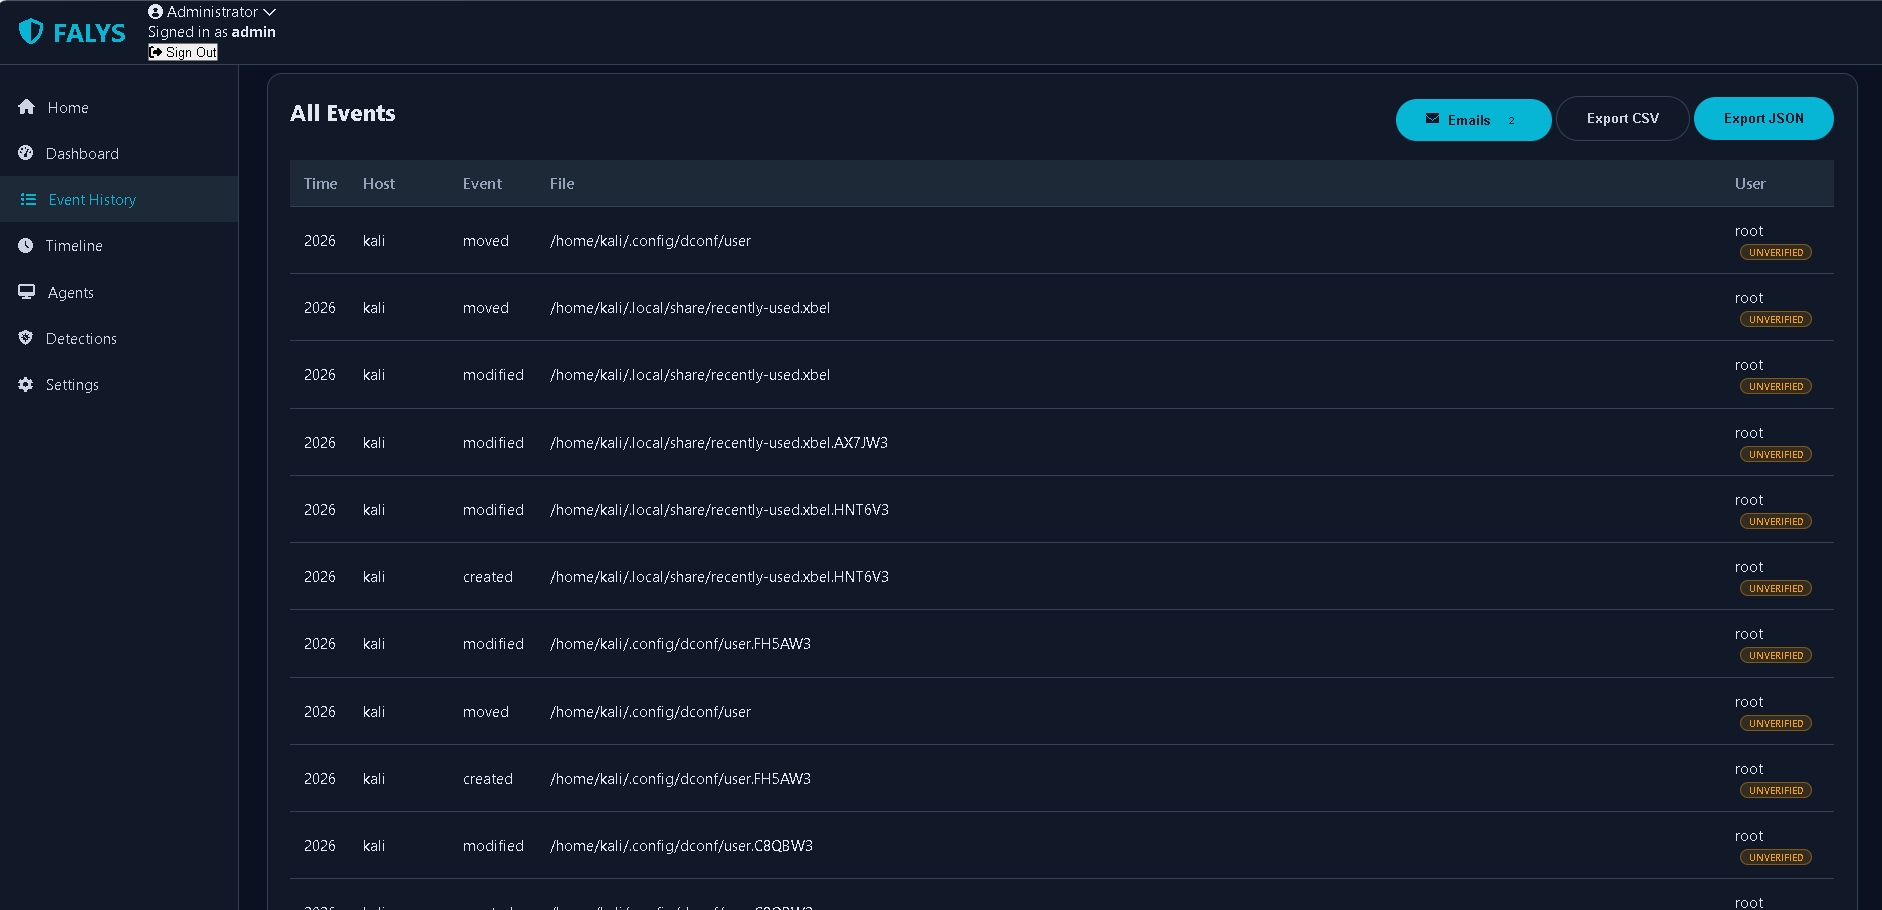
All Events lists every event the agents have reported. Use Export CSV or Export JSON to download the data. The User column shows who touched the file; it is marked UNVERIFIED until you enable OS-level auditing on the endpoint (see File Event Attribution).
Timeline
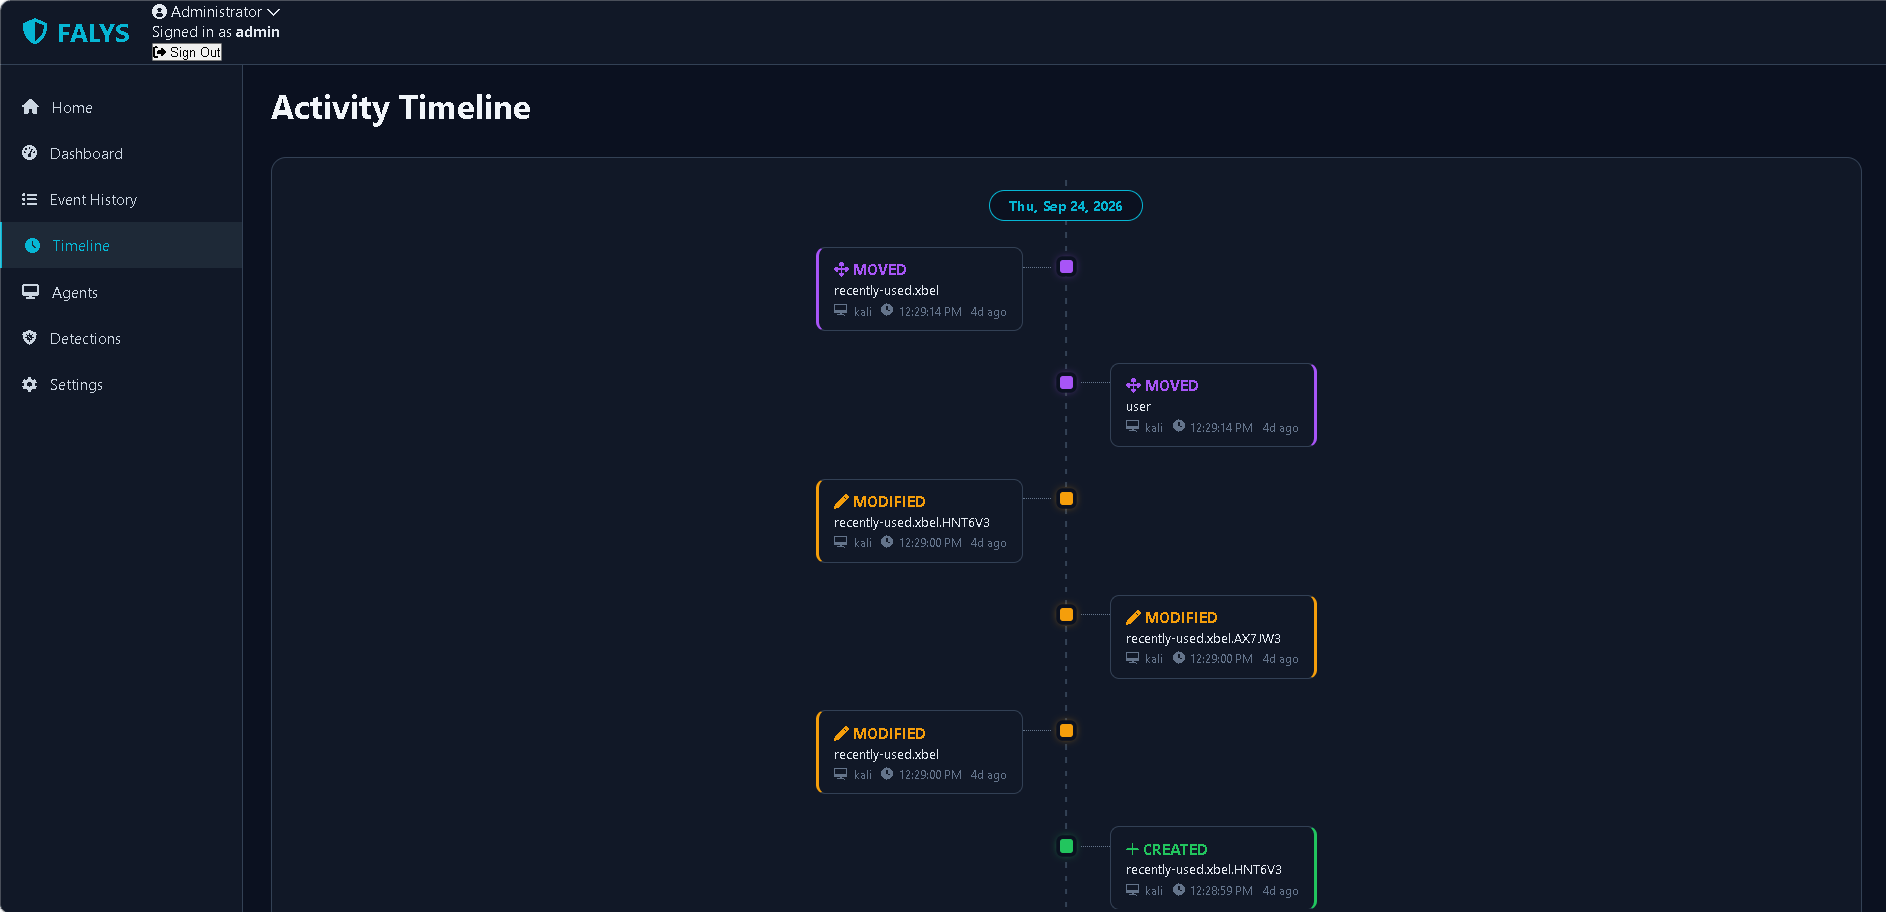
The Timeline shows the same events in chronological order, colour-coded by type (created, modified, moved, deleted).
Agents
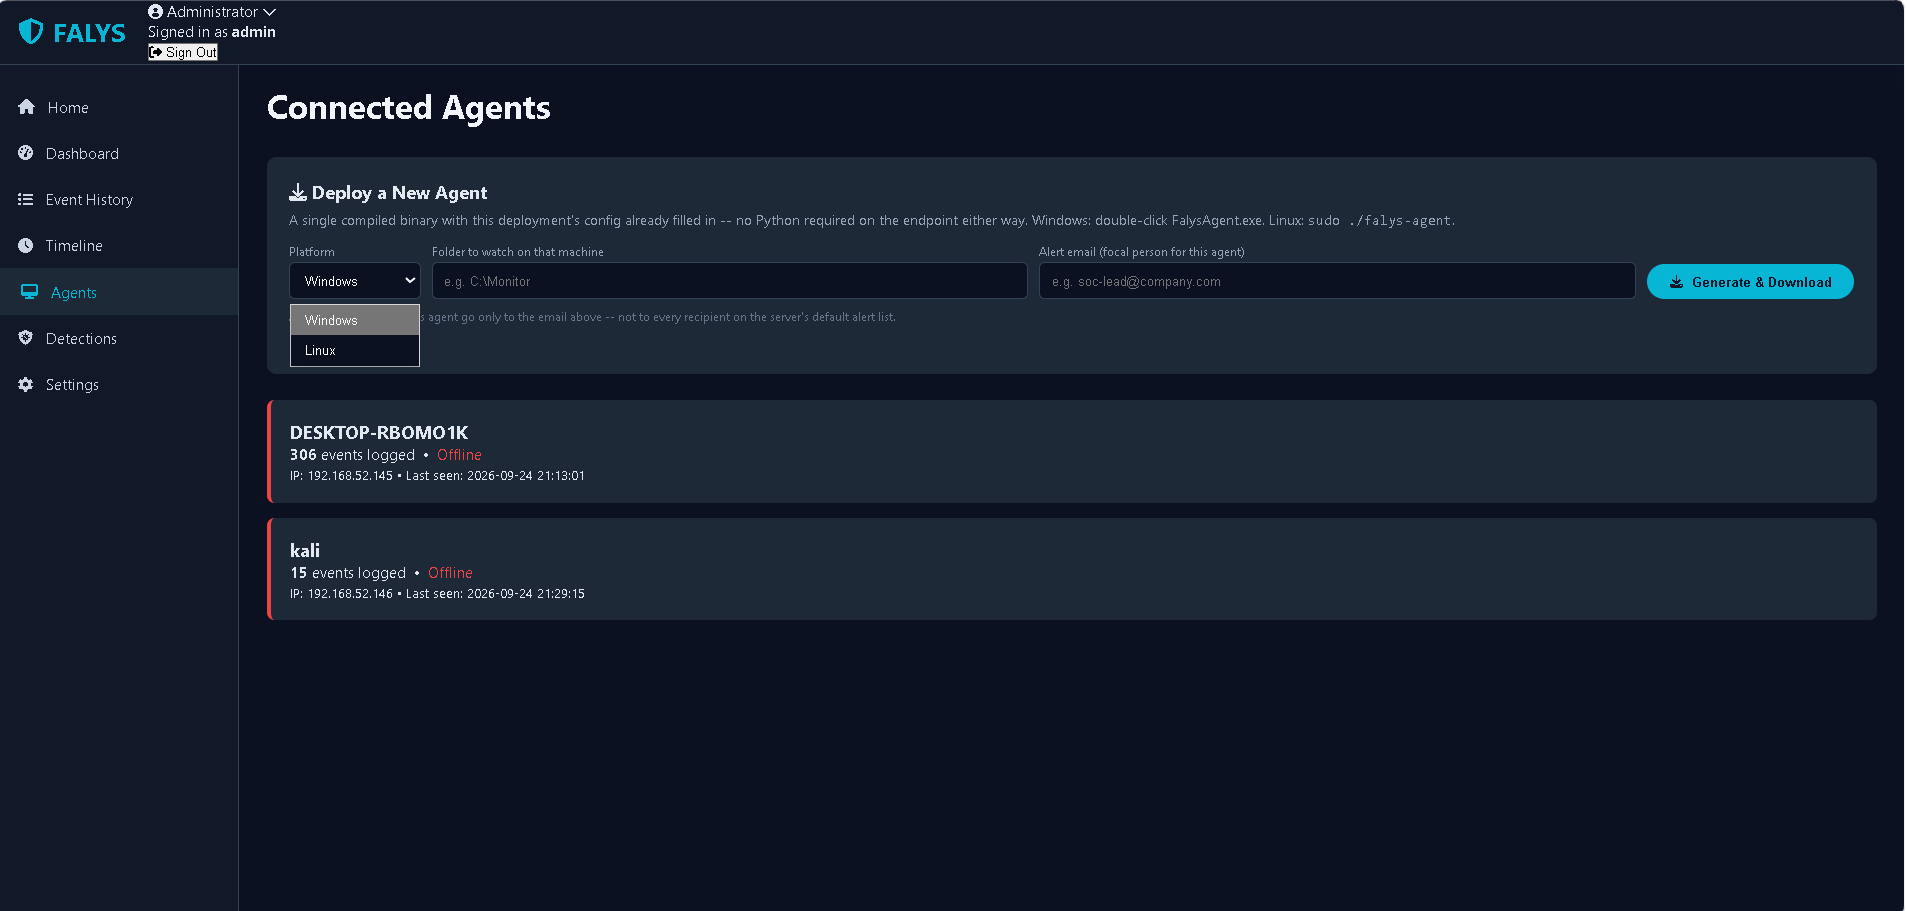
This is where you deploy and monitor agents.
- Choose the Platform (Windows or Linux).
- Enter the folder to watch on the target machine.
- Enter the alert email that should receive alerts for that agent.
- Click Generate & Download, copy the downloaded package to the endpoint, and run it as described in Agent Deployment.
Every connected agent is listed below the form with its event count, IP address, online/offline status and the time it was last seen.
Detections
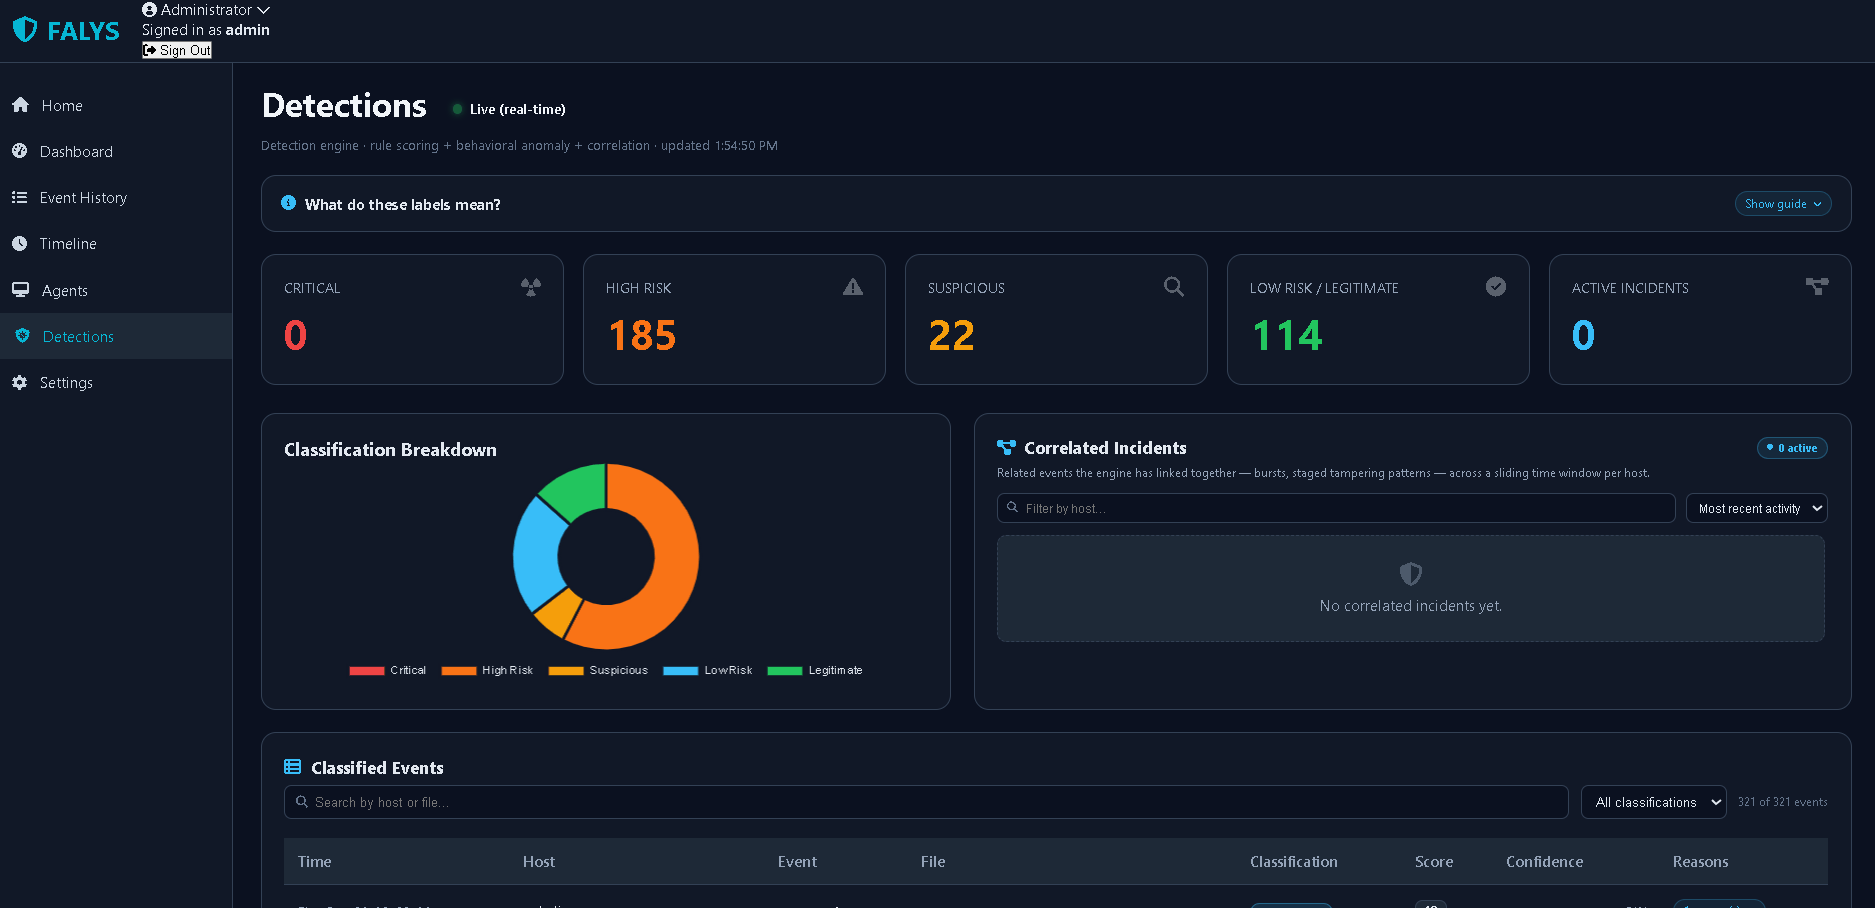
The Detections page shows how the detection engine classified every event as Critical, High Risk, Suspicious, Low Risk or Legitimate. Click Show guide under What do these labels mean? for a plain-language explanation. Related events that the engine has linked together (for example a burst of changes on one host) appear as Correlated Incidents.
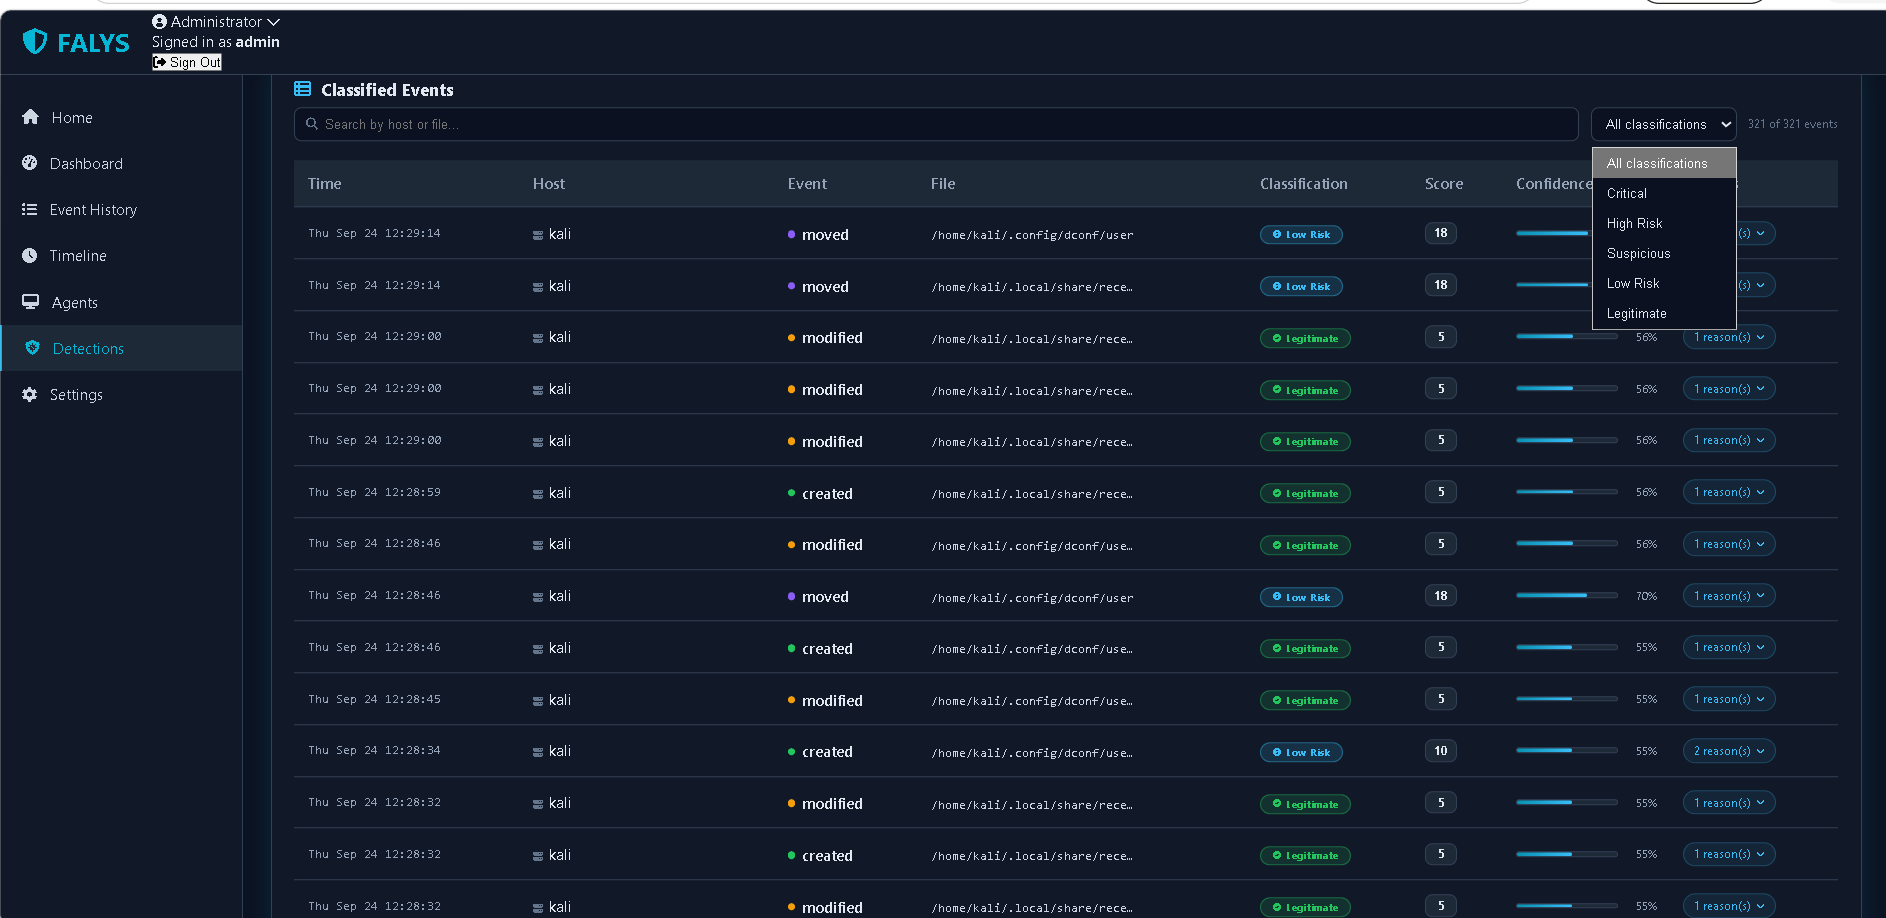
Classified Events lists each event with its classification, score, confidence and the reasons behind the score. You can search by host or file and filter by classification. See Detection Engine for how scores are calculated.
Settings
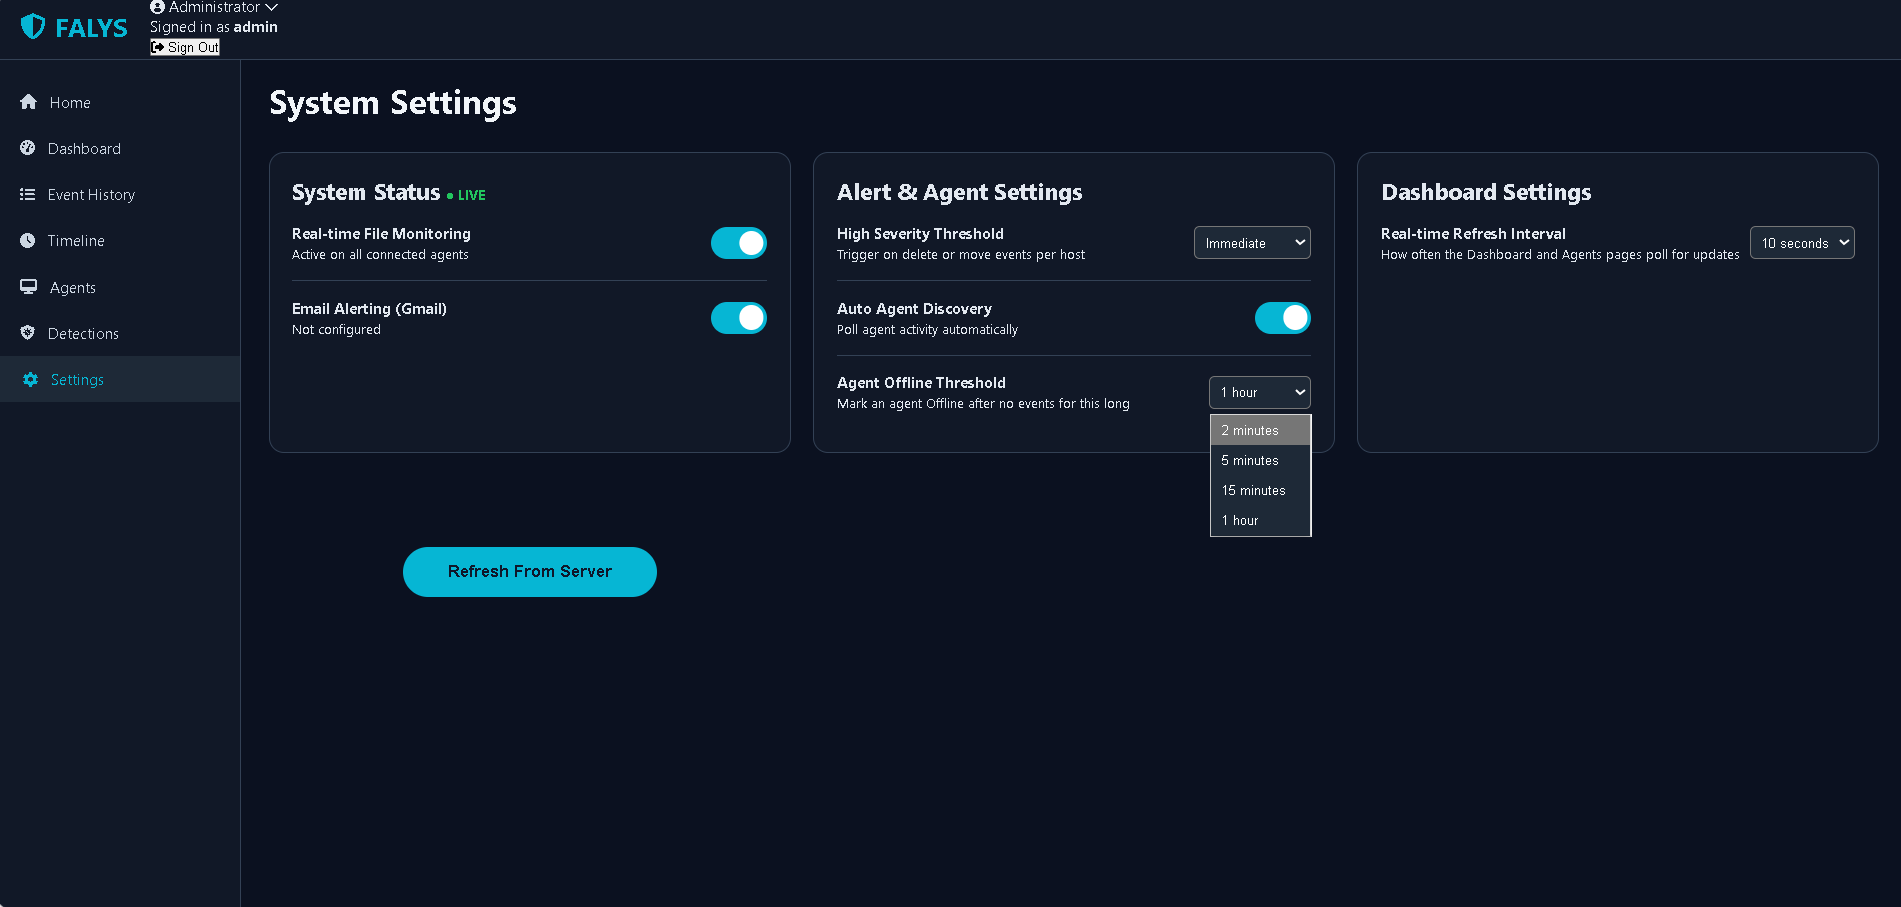
| Setting | What it does |
|---|---|
| Real-time File Monitoring | Master switch: when off, agent events no longer trigger alerts. |
| Email Alerting (Gmail) | Master switch for alert emails. The line under it reads Not
configured until a Gmail sender and app password are set in
.env. |
| High Severity Threshold | How many high-severity events on one host trigger an alert: Immediate, After 1 event or After 3 events. |
| Auto Agent Discovery | Keeps polling agent activity automatically. |
| Agent Offline Threshold | Marks an agent Offline after no events for 2 minutes, 5 minutes, 15 minutes or 1 hour. |
| Real-time Refresh Interval | How often the Dashboard and Agents pages poll for updates (2, 3, 5 or 10 seconds). |
Changes are saved immediately.
Customization
This chapter explains what you can change and how, from no-code settings to editing the source. Most changes need no restart.
1. Settings page (no code)
Alerting, thresholds, the offline timeout and the refresh interval are all on the Settings page (see Using the Dashboard).
2. Configuration file
(.env)
Ports, the admin login, e-mail credentials, TLS and the database are
set in FALYS-server/server/.env. Every variable is listed
in the Environment variable reference in Installation &
Setup. Restart the server after editing.
3. Detection rules (no restart)
The rules that decide how risky an event is are stored in the database and are edited through the dashboard's API. Changes apply within a couple of seconds.
How to make a change. Log in, open the Settings page, open your browser's developer console (F12 -> Console) and paste this helper once:
const csrf = document.querySelector('meta[name="csrf-token"]').content;
async function api(path, body) {
  const r = await fetch(path, {
    method: body ? 'POST' : 'GET',
    headers: {'Content-Type': 'application/json', 'X-CSRFToken': csrf},
    body: body ? JSON.stringify(body) : undefined
  });
  return r.json();
}
Then read the current rules with
await api('/api/risk-rules').
| Rule | Meaning | Default |
|---|---|---|
default_severity_by_event |
Baseline severity per event type | created/modified = low, deleted/moved = medium |
sensitive_path_rules |
List of {pattern, severity}; patterns are
case-insensitive wildcards matched against the full path |
built-in list (e.g. *shadow, *.pem,
*id_rsa*, cron and log paths) |
permission_change_severity |
Severity when a file's permissions change | high |
frequency_rule |
If one host exceeds event_threshold events in
window_seconds, escalate to escalate_to |
50 events / 60 s -> critical |
alert_threshold |
Minimum severity that sends an alert e-mail | high |
alert_on_new_correlated_incidents |
E-mail once when a new incident opens | true |
critical_hosts |
Host names (wildcards allowed) treated as high-value assets | empty |
Severity values are low, medium,
high and critical. Rules can only raise
attention: the highest severity that any rule assigns always wins.
Example - treat a folder as critical. Saving a list replaces the whole list, so read it first, add to it, and save it back:
const rules = await api('/api/risk-rules');
rules.sensitive_path_rules.push({pattern: '*/finance/*', severity: 'critical'});
await api('/api/risk-rules', {sensitive_path_rules: rules.sensitive_path_rules});
Example - e-mail on Suspicious events too, and mark servers as critical:
await api('/api/risk-rules', {alert_threshold: 'medium', critical_hosts: ['DC-*', 'FINANCE-01']});Example - change the burst rule (send the whole object):
await api('/api/risk-rules', {frequency_rule: {window_seconds: 30, event_threshold: 100, escalate_to: 'high'}});4. Detection engine tuning (no restart)
Scoring weights and class boundaries are read from
/api/engine-config. You can send just the values you want
to change; nested values are merged.
| Section | Keys | Defaults |
|---|---|---|
weights |
rule, anomaly, correlation
(should add up to about 1.0) |
0.5 / 0.3 / 0.2 |
classification_thresholds |
minimum score for low_risk, suspicious,
high_risk, critical |
10 / 30 / 55 / 80 |
anomaly |
rate_zscore_threshold,
business_start_hour, business_end_hour |
3.0 / 7 / 20 |
correlation |
window_seconds, burst_event_threshold,
burst_min_score |
120 / 5 / 30 |
// Working hours 09:00-18:00 and a stricter "High Risk" boundary
await api('/api/engine-config', {anomaly: {business_start_hour: 9, business_end_hour: 18},
                                 classification_thresholds: {high_risk: 50}});
Reset to defaults: run
DELETE FROM server_kv WHERE key = 'risk_rules'; (or
'engine_config', 'settings') in
PostgreSQL.
5. What each agent watches
(config.json)
Each downloaded agent package contains a config.json.
You can edit it on the endpoint and restart the agent service
(FalysAgent on Windows,
sudo systemctl restart falys-agent on Linux).
| Key | Meaning | Default |
|---|---|---|
watch_dir |
Folder to monitor | set when you generate the package |
alert_email |
Recipient for this agent's alerts | set when you generate the package |
extra_exclude_patterns |
Extra wildcard patterns to ignore, e.g.
["*/backups/*", "*.tmp"] |
none |
debounce_seconds |
Merge rapid repeat events on the same file | 2 |
max_hash_bytes |
Largest file that is hashed | 200 MB |
worker_threads |
Parallel event workers | 4 (8 when the watched folder is a whole drive such as C:\ or /) |
Do not change server, api_key or
discovery_token; they tie the agent to your server.
Temporary folders, caches, node_modules and
.git are already excluded by default.
6. E-mail alerts
In server/email_service.py:
ALERT_THROTTLE_SECONDS(default 30) - minimum gap between alerts to the same recipient.build_email_body()- the plain-text body of the alert e-mail.- The subject line is built as
FALYS Alert - <event>(two places in the file).
Per-agent recipients are set when you generate a deployment package;
FALYS_ALERT_RECIPIENTS in .env is the
server-wide fallback list.
7. Branding and look
Name and logo: the page title and the shield icon/
FALYStext in the top bar are in each file inserver/templates/(search forclass="logo"). Replace the Font Awesome icon class or the text.Colours: all styling is in
server/static/style.css. Search the file (case-insensitive) for these values and replace them everywhere:Colour Used for #06B6D4Accent (buttons, highlights, numbers) #111827Panels and bars #1E2937Cards #334155Borders #E2E8F0/#94A3B8Main / muted text #EF4444/#22C55EDanger / success Chart colours are set inside the
<script>blocks ofindex.htmlanddetections.html.
8. Changing the source code
- Running from source: stop the server and start it again.
- Using a compiled server binary: rebuild it after
any change (
build_server_exe.ps1orbuild_server_exe_linux.sh). - Agent code: rebuild the agent binaries as described
in Agent Deployment and copy the results, with their
VERSION.txt, toserver/build_output/. If you change the agent version, updateAGENT_SOURCE_VERSIONinserver/deployment_builder.pyto match. - Run the tests in
server/tests/after larger changes (the PostgreSQL tests needFALYS_TEST_DATABASE_URLpointing at a throwaway database and are skipped without it; see Running the tests).
9. Retention
Events are kept until you delete them. See Retention in PostgreSQL Setup for the pruning command.
PostgreSQL Setup
FALYS keeps all of its data in PostgreSQL. There are
no event files, JSON settings files or key files anywhere. The only
thing the server still writes to disk is its TLS certificate and key
(server/certs/, or the files you point
FALYS_TLS_CERT / FALYS_TLS_KEY at) -- the TLS
libraries need real file paths, and many teams supply their own
CA-issued certificate anyway.
What is stored where
| Table | Holds |
|---|---|
server_events |
Every file event, with its classification, risk score, reasons and
correlation info (the full record is in the data JSONB
column; host, event_type,
severity, classification,
event_time are indexed columns). The table's
id is the event's _id. |
server_agent_keys |
One row per issued agent API key -- SHA-256 hash only, never the key itself. |
server_kv |
Small admin-editable documents: settings,
risk_rules, engine_config,
tunnel_trust, generated_secrets. |
server_email_logs |
One row per alert email attempt (sent / skipped / failed). |
server/schema.sql is the exact DDL. The server applies
it automatically (CREATE TABLE IF NOT EXISTS) on start, so
you normally never run it yourself -- it is there for teams that prefer
to apply schema with their own tooling or a privileged account.
All tables are prefixed server_, so the same database
can safely be shared with other applications.
Setting it up
Docker (quickest):
cd server
docker compose -f docker-compose.postgres.yml up -d
Existing PostgreSQL server (PostgreSQL 12+, tested on 16) -- as a superuser:
CREATE ROLE falys LOGIN PASSWORD 'choose-a-strong-password';
CREATE DATABASE falys OWNER falys;
On PostgreSQL 15+ the owner of a database can create tables in it. If
you use a different setup, make sure the role has CREATE on
the schema it will use:
\c falys
GRANT USAGE, CREATE ON SCHEMA public TO falys;
Then set the connection in server/.env:
FALYS_DATABASE_URL=postgresql://falys:choose-a-strong-password@db-host:5432/falys?sslmode=requireor the separate FALYS_DB_HOST,
FALYS_DB_PORT, FALYS_DB_NAME,
FALYS_DB_USER, FALYS_DB_PASSWORD,
FALYS_DB_SSLMODE variables. Use
sslmode=require (or stricter) whenever the database is on
another machine.
Behaviour to know about
- Startup: the server retries the connection for up
to 30 seconds (
FALYS_DB_CONNECT_TIMEOUT_SECONDS), so it can start alongside PostgreSQL, then exits with a clear message if it still can't connect. - Database outage while running: an event that can't be stored is answered with HTTP 503 and is not marked as received; agents built from this version retry and then queue it on the endpoint and replay it later, so events are not lost. Agent authentication keeps working from its in-memory key list during a short outage. Older agent builds treat any HTTP response as delivered, so rebuild and redeploy the agents (see Agent Deployment).
- One server per database: the dashboard's live counters and recent events cache are kept in the server process and rebuilt from the database at start. Run a single FALYS server instance per database.
- Startup cost: rebuilding that state uses a few
aggregate queries, not a replay of the whole history, so start-up time
does not grow with the size of
server_events. - Settings/rules changes made in the dashboard take effect within about 2 seconds (short in-process cache); key revocation is immediate.
Backups
Everything is in the one database, so a standard PostgreSQL backup is a complete FALYS backup:
pg_dump -Fc -h db-host -U falys falys > falys-$(date +%F).dump
# restore into an empty database:
pg_restore -h db-host -U falys -d falys --clean --if-exists falys-2026-09-24.dump
Retention
Events are kept forever unless you prune them. To drop events older than, say, 400 days (the dashboard's live counters are rebuilt from the table at the next server restart):
DELETE FROM server_events WHERE event_time < now() - interval '400 days';Upgrading from a flat-file install
Earlier FALYS versions wrote a server/logs/ folder
(events/*.jsonl, agent_keys.json,
settings.json, ...). To move that data across:
Stop the FALYS server.
Set up PostgreSQL and
server/.envas above.From
server/, run:python migrate_flat_files_to_postgres.py # reads ./logs # python migrate_flat_files_to_postgres.py --logs-dir /path/to/old/logsEvent ids are preserved, so agents and integrations that track event ids carry on seamlessly. The script never modifies or deletes the old files, and is safe to re-run. Existing documents in the database are kept unless you pass
--overwrite.Start the server, check the dashboard, then archive the old
logs/folder.
Running the tests
createdb falys_test        # a throwaway database -- its FALYS tables are emptied
cd server
FALYS_TEST_DATABASE_URL=postgresql://falys:pw@localhost:5432/falys_test \
  python -m unittest discover -s tests -p "test_postgres_store.py" -v
Agent Deployment
Endpoints on both Windows and Linux receive a single compiled binary and don't need Python installed -- the same "just run the file" model as most compiled agents.
- Windows (
FalysAgent.exe): applies the required Windows audit policy silently, registers and starts itself as a Windows service, starts monitoring immediately and on every subsequent boot. Entire install: download, unzip, double-click, click "Yes" on one admin prompt. - Linux (
falys-agent): applies the required auditd policy, installs itself to/opt/falys-agent, writes and enables a systemd service, starts monitoring immediately and on every subsequent boot. Entire install: download, unzip,sudo ./falys-agent.
No PowerShell, no batch files, no pip install, no manual
python agent.py on either platform.
The monitoring logic itself (agent.py,
attribution.py, discovery.py) is identical on
both platforms -- it's compiled into each binary as-is. Communication
with the server and the registration model are the same regardless of
platform.
Architecture
agent/agent.py                <- monitoring logic (main()/stop())

agent/windows_service.py      <- pywin32 Windows Service wrapper +
                                  self-install logic. Compiled into
                                  FalysAgent.exe.
agent/FalysAgent.spec         <- PyInstaller build spec (Windows)
agent/build_exe.ps1           <- one-time build script (Windows, IT-run)

agent/linux_service.py        <- systemd wrapper + self-install logic.
                                  Compiled into falys-agent.
agent/FalysAgentLinux.spec    <- PyInstaller build spec (Linux)
agent/build_exe_linux.sh      <- one-time build script (Linux, IT-run)

server/deployment_builder.py  <- packages the prebuilt binary (either
                                  platform) + a fresh per-deployment
                                  config.json
server/build_output/          <- the compiled FalysAgent.exe and
                                  falys-agent binaries go here (build
                                  them once -- see below)
Building the agent binaries
Ready-made agent binaries -- FalysAgent.exe (Windows,
x86-64) and falys-agent (Linux, x86-64) -- are included in
server/build_output/, together with a
VERSION.txt (2.2.0) that the dashboard checks.
The dashboard's Agents page hands them out
directly.
They were built from the agent source in agent/ using
the included PyInstaller build scripts (agent/build_exe.ps1
and agent/build_exe_linux.sh). SHA-256 checksums of the
shipped binaries:
| File | SHA-256 |
|---|---|
FalysAgent.exe |
ad611624380ea1e47458203461d42a0b821fc632a21268a7648739981e613817 |
falys-agent |
871bd88fa7f45536c7d66cd575dc3457c17d52bb9a471242856123e3fb51ffaf |
If you would rather not use the shipped binaries, delete them from
server/build_output/ and build your own as described below;
until a binary for a platform exists, the Agents page gives you a
build kit for that platform (source + instructions)
instead.
To build (and again whenever you modify the agent source):
- Compiling
FalysAgent.exerequires runningagent/build_exe.ps1on a Windows machine with Python installed; compilingfalys-agentrequires runningagent/build_exe_linux.shon Linux. PyInstaller doesn't cross-compile, so each binary needs to be built on a matching OS. - After building, drop the resulting binary and the
VERSION.txtthe build script writes next to it intoserver/build_output/-- the dashboard picks it up immediately for that platform. No compiler ever runs on the server itself. - The two platforms are independent: you can rebuild one without touching the other.
Linux-specific note: unlike a statically-linked
Go/Rust binary, a PyInstaller binary is only portable across machines
with a compatible-or-newer glibc than the one it was built on. Build
falys-agent on the oldest distro version you need to
support (see build_exe_linux.sh's header comment) so that
endpoints on older distros don't hit a GLIBC_2.XX not found
error. Windows has no equivalent concern.
Why a self-installing EXE instead of an MSI
A self-installing exe gets you the same practical end-user experience
as an .msi -- double-click, one admin prompt, done --
without requiring the WiX Toolset to build and maintain an
installer.
If your organization specifically needs .msi for a
software-push tool (SCCM/Intune/GPO), the cleanest path is to wrap the
existing FalysAgent.exe in a thin WiX or Inno Setup
installer whose only job is to lay the exe + config.json on disk and run
FalysAgent.exe once.
TLS (cert.pem)
The server terminates HTTPS itself using a self-signed certificate it
generates on first run under server/certs/. There's no
public CA for a LAN-only server, so instead of a browser-style
certificate chain, each agent pins the server's exact certificate: it
ships as cert.pem inside the deployment package, next to
config.json, and agent.py verifies every
connection against that specific file (see agent.py's
CERT_PATH/_verify_param()).
Practical implications:
config.json's"server"field ishttps://...for every generated package.- If the server's certificate is ever regenerated -- e.g. its LAN IP
changed enough that the old certificate's SAN list no longer covers it
-- existing agents' pinned
cert.pemgoes stale and their uploads start failing the TLS check (queued locally, not lost; seeagent.py's retry/queue behavior). Redeploy affected agents to pick up the newcert.pem. - Point
FALYS_TLS_CERT/FALYS_TLS_KEYat a real internal-CA-issued certificate instead if your organization has one; the self-signed path is the zero-config default, not a requirement. FALYS_TLS_ENABLED=0reverts to plaintext HTTP (shared API key only, no encryption) -- for a throwaway local test only, never a real deployment.
Windows service startup
The compiled Windows agent is started by the Service Control Manager
(SCM) on boot, exactly like any other Windows service:
SvcDoRun reports SERVICE_RUNNING immediately,
then does its actual work (loading config, connecting to the server) on
a background thread with retry-with-backoff and logging
(service.log next to the exe, plus the Windows Event Log).
That keeps the service in a running/retrying state rather than exiting
if a config or network issue is hit right at startup. A zero-argument
launch is routed to StartServiceCtrlDispatcher() (the SCM's
own launch signature), falling back to the interactive double-click
installer flow only when that call fails -- the one reliable signal that
the process wasn't started by the SCM.
Linux has no equivalent handshake to get right: systemd's
--service-run path is a straightforward foreground run with
its own retry-with-backoff loop (see linux_service.py's
module docstring for the full comparison).
File Event Attribution
What this is
By default, every FALYS agent reports the OS user its own process is
running as (getpass.getuser()). That is
not the same thing as "the user who touched the file" —
a service, a scheduled task, or an agent running under a shared/service
account can all touch files on behalf of someone else, and the
process-level user won't reflect that.
To get a trustworthy answer to "who actually did this", FALYS queries the operating system's own audit trail:
| Platform | Mechanism | Requires |
|---|---|---|
| Linux | auditd / ausearch |
An audit watch rule on the monitored folder |
| Windows | Security event log (wevtutil, event ID 4663) |
Object Access auditing + a SACL on the monitored folder |
Neither is enabled by default on a fresh OS install. The compiled
agent binaries apply this audit setup automatically while they install
themselves (Windows: the one admin prompt; Linux: sudo),
provided the watched folder already exists on the endpoint at
that moment. If the folder did not exist yet, or you later
change watch_dir, create the folder and re-run the agent
installer, or run the setup script below for that folder. Until
auditing is in place for the watched folder, attribution lookups will
consistently return unverified — this is expected, not
a bug, and the dashboard labels it as such rather than guessing.
How to tell if it's working
Every event the agent sends includes:
{
  "user": "alice",                  // process-level user (always present)
  "attributed_user": "jdoe",           // OS-audit-verified user, or null
  "attribution_verified": true,        // true only if a real audit record was found
  "attribution_source": "auditd"       // or "security_log", or a reason code if unverified
}
In the Event History page, the User column shows a
green "Verified" badge with the audited account when
attribution_verified is true, and an amber "Unverified"
badge with the process-level fallback otherwise.
attribution_source when unverified tells you why,
e.g.:
ausearch_not_installed/wevtutil_not_available— the OS audit tool isn't presentno_audit_record/no_security_event— the tool is present, but no matching record was found (most commonly: the setup script below hasn't been run yet for this path)unresolvable_uid/unparseable_event— a record was found but couldn't be fully parsed
Linux setup
sudo ./agent/setup_audit_linux.sh /path/to/watched/dirThis installs auditd if needed, adds a persistent watch
rule (-w <dir> -p wa -k falys_watch), and loads it
immediately.
Verify manually:
sudo auditctl -l | grep falys_watch
touch /path/to/watched/dir/test.txt
sudo ausearch -f /path/to/watched/dir/test.txt -ts recent
Windows setup
Run from an elevated PowerShell prompt:
.\agent\setup_audit_windows.ps1 -WatchDir "C:\watch_falys\monitor"This enables Object Access → File System auditing
(auditpol) and applies a SACL to the watched folder so
access to files inside it actually gets logged (auditing policy alone
does nothing without a SACL on the object).
Verify manually:
auditpol /get /subcategory:"File System"
Get-Acl -Path "C:\watch_falys\monitor" -Audit | Format-List
New-Item -Path "C:\watch_falys\monitor\test.txt" -ItemType File
Get-WinEvent -FilterHashtable @{LogName='Security'; Id=4663} -MaxEvents 5
Technical notes
- Windows event ID 4663 is only generated when a process opens the file with a monitored access right (write, delete, permission change, etc.) — a plain directory listing won't trigger it.
ausearchoutput formatting varies across distributions and auditd versions. This module deliberately resolves numeric UIDs itself via the local passwd database rather than depending onausearch -i's inline name substitution, specifically to avoid being brittle to that variance.- Attribution lookups run on a background worker thread (see
agent/agent.py) so they never block the filesystem watcher, but they still add a few hundred ms to a few seconds of latency between a file event happening and it appearing in the dashboard.
Detection Engine
What this is
FALYS's /log ingestion route used to do one thing: run a
single deterministic rule pass (risk_classifier.py) and
store a low/medium/high/critical severity. That still exists, but it's
now one of three signals feeding a proper detection engine, modeled on
the same pipeline shape commercial EDR/XDR products use (Defender for
Endpoint, CrowdStrike Falcon, SentinelOne, Elastic Security): collect
context, score from multiple independent angles, correlate across
events, and classify with an explicit confidence value plus explainable
reasons — not just a bare severity string.
Nothing about the agent API changed. Agents still
POST the exact same JSON payload to /log with
the same X-API-Key header they always did. All existing
routes, the dashboard pages, alerts, and agent deployment/generation
flows are unmodified. The engine is entirely a server-side addition.
Architecture
server/
  engine/
    __init__.py       <- public entry point: analyze_event()
    engine.py          <- orchestrator, wires the stages below together
    context.py          <- 1. Context Collection
    rule_scoring.py     <- 2. Rule-Based Risk Scoring
    anomaly.py           <- 3. Behavioral Anomaly Detection
    correlation.py        <- 4. Event Correlation
    classifier.py          <- 5. Confidence-Based Classification
    state.py         <- shared bounded/thread-safe primitives used by
                         every stage above (LRU caches, rolling windows,
                         online mean/variance)
  engine_config_store.py  <- admin-editable weights/thresholds/tuning
                              (PostgreSQL, server_kv "engine_config")
  risk_rules_store.py     <- unchanged: admin-editable rules the RULE
                              stage consumes (sensitive paths, event-type
                              severities, critical_hosts, ...)
  server.py                <- /log calls engine.analyze_event() once per
                               event; everything else (routes, alerts,
                               dashboard) is unchanged
The five stages, per event
- Context Collection (
context.py) — is this host/user new, is it business hours, is this the first time this user has touched this directory, is the host tagged as a critical asset. Pure fact gathering, no scoring. - Rule-Based Risk Scoring
(
rule_scoring.py) — the original deterministic logic (event-type baseline, sensitive-path globs, permission-change detection, burst-frequency), now producing a 0-100 score instead of just a tier, admin-editable via/api/risk-rulesexactly as before. - Behavioral Anomaly Detection
(
anomaly.py) — no fixed rules; builds a per-host statistical baseline (online mean/variance of events-per-minute, an hour-of-day activity histogram) and flags deviations from that specific host's own history, plus novelty flags for "first time this user has used this host/path." - Event Correlation (
correlation.py) — groups related events within a sliding time window per host: bursts, staged tampering patterns (permission loosened → sensitive file touched → deleted), and cross-host activity by the same attributed user. ProducesINC-xxxxxxxxxxincident records, listed atGET /api/incidents. - Confidence-Based Classification
(
classifier.py) — combines the three scores (weighted, admin-tunable) into one 0-100 score, maps it to a tier (Legitimate / Low Risk / Suspicious / High Risk / Critical), and computes a separate 0-100 confidence value driven by how mature the anomaly baseline is and how many independent signals agree.
Fault tolerance
engine.py's orchestrator wraps every stage individually.
If any one stage raises (bad data, an edge case in a statistical
calculation, whatever), that stage's contribution degrades to a safe
default and a warning is logged — ingestion never stops because a
detector had a bug. This mirrors how a production EDR pipeline should
behave: a scoring regression should degrade detection quality, not
availability.
What gets stored per event
server.py's /log route now stores, in
addition to the pre-existing fields:
{
  "severity": "high",                  // legacy, unchanged meaning
  "classification": "High Risk",
  "confidence": 82,
  "risk_score": 71,
  "reasons": [
    "Path matches sensitive-path rule '*shadow' (critical)",
    "File permissions changed from their last known value (escalates to 'high')",
    "Staged tampering pattern on this host: permission_change -> sensitive_hit within 120s"
  ],
  "correlation_id": "INC-11b2ad78e6",
  "signals": {"rule": 65, "anomaly": 35, "correlation": 55}
}
should_alert() (rules.py) decides whether an
event sends an alert e-mail. It compares the legacy
severity field with the admin-configured
alert_threshold, and — when
alert_on_new_correlated_incidents is true — also alerts once
for the event that opens a new correlated incident. It never alerts while
Real-time File Monitoring is switched off in Settings.
New API routes
| Route | Method | Purpose |
|---|---|---|
/api/engine-config |
GET | Read the engine's weights/thresholds/tuning |
/api/engine-config |
POST | Patch weights/thresholds (same unknown-key-rejection pattern as
/api/risk-rules) |
/api/incidents |
GET | Recent correlated incidents (?limit=N) |
/api/stats gained a classification_counts
field (5-tier breakdown) alongside the existing
severity_counts (4-tier) — both are populated from every
event going forward; older events default to
Legitimate/low rather than skewing the new
breakdown.
A new dashboard page, Detections
(/detections), shows the classified event table (with
expandable reasons and a confidence bar) and the correlated-incidents
feed.
Tuning
Everything scoring-related is data, not code, editable at runtime:
risk_rules_store.py(/api/risk-rules) — sensitive-path globs, event-type baseline severities, permission-change severity, the frequency-burst rule,alert_threshold, and the newcritical_hostslist.engine_config_store.py(/api/engine-config) — signal weights (rule/anomaly/correlation), classification-tier score boundaries, the anomaly stage's z-score threshold and business-hours window, and the correlation stage's window/burst thresholds.
Both follow the same pattern: a DEFAULT_* dict, a JSON
document in PostgreSQL (table server_kv), and a
set_*() that only accepts known keys and merges rather than
overwrites nested sub-dicts.
Dynamic IP Discovery
The problem
Both the central server and the agent endpoints are on DHCP, so their
IPs change over time. Previously, the agent's config.json
had the server's IP hardcoded — once that IP changed, the agent had no
way to find the server again, and connectivity was lost completely until
someone manually updated config.json with the new
address.
The solution
Since the server and all agents share the same enterprise LAN (same broadcast domain/subnet), this uses a small UDP broadcast discovery protocol — no extra infrastructure (no DNS server, no dependency on internet access) required.
What happens on
server.py startup
- Resolves its own current LAN IP
(
discovery.get_local_ip()). - Immediately broadcasts a
falys_announceUDP packet on the LAN so any agent already running picks up the current IP right away. - Starts a background listener that answers any agent's
falys_discoverbroadcast directly with its current IP. - Starts a background watchdog that re-checks its own IP every 30s; if it ever changes while running, it re-broadcasts immediately.
What happens on
agent.py startup
- Resolves its own current LAN IP the same way (used in every event's
ipfield, instead of the oldsocket.gethostbyname(socket.gethostname())call, which is unreliable — commonly returns127.0.1.1or the wrong interface on multi-homed machines). - Checks whether the server address currently in
config.jsonis still reachable and genuinely the FALYS server (via a/healthcheck — see "Authentication" below). If yes, nothing changes. - If not, broadcasts a
falys_discoverrequest on the LAN and waits for an authenticated reply. If found, updatesconfig.jsonimmediately so the next restart also starts from the right address. - If nothing answers, the agent keeps queuing events locally (existing offline-queue behavior) and retries discovery every 20s in the background until the server is found.
- For the rest of the session, a background listener watches for the server announcing itself again (step 2 of the server's startup, or its periodic re-announce if its IP changes later) and updates immediately — so a live agent recovers from a server IP change without needing to be restarted.
Authentication ("is this really the server?")
Broadcast discovery on its own just tells you something
answered on a port — not that it's genuinely the FALYS server and not
some other device. Both sides are configured with the same shared secret
(FALYS_DISCOVERY_TOKEN on the server, and
discovery_token in every agent's config.json). Every discovery message carries
a one-way hash of that secret
(sha256("FALYS_DISCOVERY_V1:" + token + ":" + time-bucket),
where the time bucket changes every 5 minutes so a captured packet
cannot be replayed indefinitely) — never the secret itself — so:
- A device that doesn't know the token gets ignored, even if it responds on the same port.
- Packet-sniffing the LAN doesn't reveal the secret.
There is no shared default token. If
FALYS_DISCOVERY_TOKEN is not set in .env, the
server generates a random token on first start and keeps it in
PostgreSQL (see First run and
login). Every agent package generated from the dashboard gets the
server's current token written into its config.json
automatically. To use a value of your own, set
FALYS_DISCOVERY_TOKEN in .env
before generating agent packages. If the token is changed
later, agents built with the old one keep working while the server's
address stays the same, but they can no longer re-find the server
automatically until they are redeployed.
Verified behavior (tested in this environment)
- Agent configured with a deliberately wrong/unreachable server IP →
detects the failure → broadcasts → finds the real server → updates and
persists
config.json→ all within the same run, no restart. - A running agent, already correctly configured, receives a live
falys_announcefor a genuinely different IP → updates immediately, no restart. - A discovery request carrying the wrong token is correctly ignored.
Network requirements and behavior notes
- Same broadcast domain. Discovery works within a single broadcast domain by default. To span routed subnets/VLANs, add a broadcast relay (e.g. a UDP relay agent, or multicast DNS with proper router support), or configure agents in other subnets with the server's hostname/IP through another means (e.g. internal DNS).
- Firewalls: UDP port
50999needs to be allowed (inbound on the server for discovery requests, and on agents for the live-announce listener) through host firewalls (Windows Firewall / iptables / firewalld). - Discovery timing: the initial discovery attempt on agent startup can take a few seconds (multiple broadcast attempts with timeouts) — this is intentional, to tolerate a slow/busy network. Events from that window are queued locally and flushed once the server is found, so nothing is lost.
Credits & Third-Party Licenses
FALYS is sold under the standard Envato Market license you selected
when you purchased it (see https://codecanyon.net/licenses/standard).
It bundles or depends on the following third-party open-source
components, each of which remains under its own license. The same list
is in Licenses.txt.
| Component | Version | License | Used for |
|---|---|---|---|
| Flask | 3.1.1 | BSD-3-Clause | Web framework (dashboard + API) |
| Werkzeug, Jinja2, MarkupSafe, ItsDangerous, Click, Blinker | see requirements.lock |
BSD-3-Clause | Flask dependencies |
| Flask-WTF / WTForms | 1.2.2 / 3.2.1 | BSD-3-Clause | Form handling / CSRF protection |
| waitress | 3.0.2 | ZPL-2.1 | Production web server |
| cheroot | 10.0.1 | BSD-3-Clause | HTTPS web server |
| requests (+ urllib3, idna, charset-normalizer) | 2.32.3 | Apache-2.0 / MIT / BSD | HTTP client |
| certifi | 2025.1.31 | MPL-2.0 | CA bundle |
| cryptography (+ cffi, pycparser) | 44.0.0 | Apache-2.0 OR BSD-3-Clause | TLS certificates |
| psycopg2-binary | 2.9.10 | LGPL-3.0-or-later (with OpenSSL exception) | PostgreSQL driver |
| watchdog | 4.0.2 | Apache-2.0 | File-system monitoring (agent) |
| pywin32 | 312 | PSF-2.0 | Windows service support (agent, Windows only) |
| PyInstaller | build tool | GPL-2.0-or-later with bootloader exception | Used to compile the agent/server binaries |
| Font Awesome Free | 6.5.1 | Icons CC BY 4.0, fonts SIL OFL 1.1, code MIT | Dashboard icons (loaded from cdnjs) |
| Chart.js | latest (CDN) | MIT | Dashboard charts (loaded from jsDelivr) |
Python itself is used under the PSF License. The dashboard pages load Font Awesome and Chart.js from public CDNs (cdnjs.cloudflare.com and cdn.jsdelivr.net); those files are not bundled in the download.